-

Email Marketing KPI Report Template | KPI Metric Report | KPI Dashboard Excel Template | Performance Tracking Report | Ready to Download
Email Marketing KPI Report Template
Email marketing is one of the most effective marketing channels today and boasts one of the highest ROIs in the industry.
For more details about the template, check the link below;
However, to find success in email marketing and meet your goals, you need to identify and monitor the appropriate email marketing KPIs.
Best for:
• Email marketers
• Digital Marketing Experts
• Everyone starting with a new project
• Marketing professionals
Content:
• Excel file compatible with Excel 2010 and higher (and with sample data)
• Professional Design
• Works both on Mac and Windows
• No installation needed. Ready to use
• Dashboard with charts
• Email Marketing KPI Dashboard Template
• Easy to use
• 100% editable
• Excel file
• Instant download
• Friendly customer support for all your questions
License: Private Use (not for distribution or resale)
$ 35 -

HR KPI Dashboard Excel Template, Human Resource Excel Kpi Report Template, Dynamic Reporting Dashboard Xlsx, Performance Tracking Report
Introducing our exclusive 🏆 HR KPI Dashboard | Human Resource Excel Kpi Report Template | Dynamic Reporting Dashboard | Performance Tracking Report.
Created for efficiency and smooth operation, this template is your perfect companion for tracking and analyzing HR metrics effortlessly.
For more details about the template, check the link below;
✔️ 😎 Unique features include:
1. 📈 Dynamic Reporting Dashboard: Gain comprehensive visibility into your human resource performance with our real-time, interactive dashboard. Customize views according to needs, and convert data into meaningful decisions.
2. 🖇️ Human Resource Excel Kpi Report Template: Take control of workforce planning and adjust strategies with precision. In a few clicks, evaluate key areas such as recruitment, retention, training, and more.
3. 📊 Performance tracking report: Never miss a beat with systematic performance tracking. Identify areas for improvement and recognize excellence all through one simplified report.
💻 Material: 100% Excel-based for seamless compatibility and function. Easy to use, modify, and integrate, our HR KPI Dashboard is all you need to elevate your business’ HR practices.
🎁 Don’t lose out on harnessing the power of data for your organization with this incredibly intuitive and user-friendly tool. Treat your business today to streamlining processes, identifying trends thus making informed decisions to drive productivity and engagement.
💖 Thank you for considering our HR KPI Dashboard for your human resource management and performance tracking needs. Don’t forget to check out our shop for even more resourceful solutions to support your mission for operational excellence. 💝
🙏 We appreciate your support and strive to serve you better, always! You deserve nothing but the best!
$ 35 -

E-commerce KPI Dashboard Excel Template | Track & Compare E-commerce Metrics | Monthly Cumulative Performance Dashboard
Take control of your e-commerce business with the E-commerce KPI Dashboard Excel Template.
For more details about the template, check the link below;
This dynamic tool is designed to help you measure and compare your e-commerce KPI metrics month by month and in cumulative analysis. Visualize your progress with dynamic charts that update based on the specific metrics you choose, and easily compare actual results with target goals. This template is user-friendly and designed to simplify performance tracking, helping you make data-driven decisions to grow your online business.
KPIs should be chosen and monitored depending on your unique business goals. Certain KPIs support some goals while they’re irrelevant for others. With the idea that KPIs should differ based on the goal being measured, it’s possible to consider a set of common performance indicators for e-commerce.
Best for:
• E-commerce industry
• Marketing professionals
• Online Shopping Experts
• Everyone starting with a new project
Content:
• Excel file compatible with Excel 2010 and higher (and with sample data)
• Professional Design
• Works both on Mac and Windows
• No installation needed. Ready to use
• Dashboard with charts
• E-commerce Kpi Dashboard Template
• Easy to use
• 100% editable
• Excel file
• Instant download
• Friendly customer support for all your questions
License: Private Use (not for distribution or resale)
$ 35 -

Finance KPI Dashboard Excel Template | Track & Analyze Financial Metrics | Monthly Cumulative Reports | Dynamic Charts | Easy to Use
Optimize your financial performance tracking with the Finance KPI Dashboard Excel Template.
For more details about the template, check the link below;
This easy-to-use template allows you to measure, compare, and analyze finance KPIs month by month, alongside cumulative data analysis. With dynamic charts that adjust based on your selected metric, you can effortlessly visualize and track financial goals, comparing actual performance against target metrics. Whether you’re focused on budgeting, profitability, or cost control, this dashboard provides actionable insights into your financial health. Ideal for finance professionals, startups, and businesses looking to streamline their financial reporting.
Regardless of the size, age, and industry, each and every company needs to be conscious of their financial performance. While accountants deal with all the expenses, income and budgets, the company’s leadership also needs to be informed about important financial measures.
After you insert your Monthly Numeric data for the KPI Metrics you determine, you can see a clear monthly and cumulative analysis for the metrics you determine. It is also possible to compare your numeric data with your target data and past year data.
The fastest and most efficient way to keep track of an organization’s business performance is to set up a KPI dashboard that displays financial metrics.
Best for:
• All types of companies
• Everyone opening a business
• Finance & accounting professionals
• Everyone starting with a new project
• Start-ups
Content:
• Excel file compatible with Excel 2010 and higher (and with sample data)
• Professional Design
• Works both on Mac and Windows
• No installation needed. Ready to use
• Dashboard with charts
• Finance KPI Dashboard Template
• Easy to use
• 100% editable
• Excel file
• Instant download
• Friendly customer support for all your questions
License: Private Use (not for distribution or resale)
$ 35 -
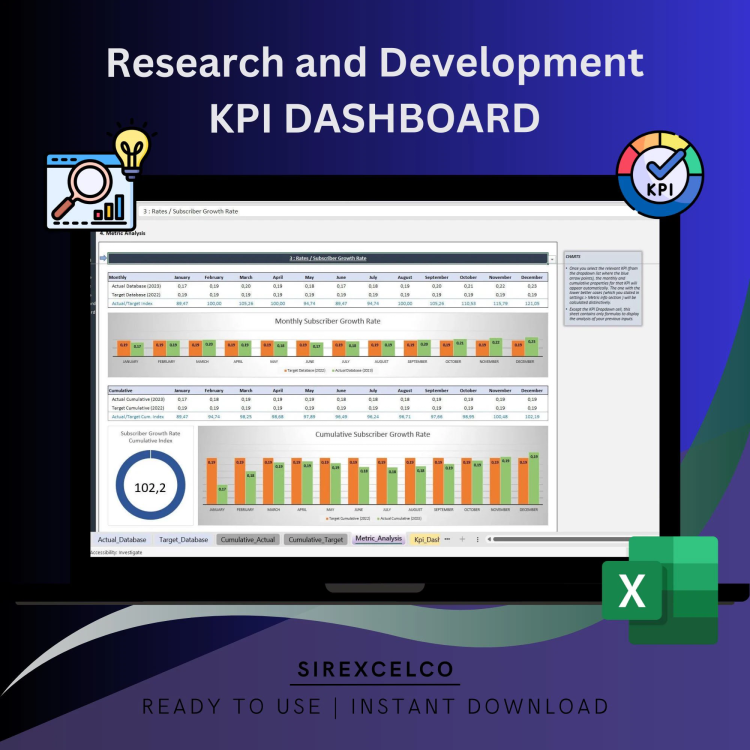
Research and Development KPI Dashboard Excel Template, KPI Report Template, Dynamic Reporting Dashboard Sheet, Performance Tracking Report
📊 **Research and Development KPI Dashboard | Excel KPI Report Template | Dynamic Reporting Dashboard | Performance Tracking Report**
For more details about the template, check the link below;
✨Introducing an innovative approach to decipher your research and development metrics within one elegant and comprehensive excel dashboard. Designed for meticulous researchers and dynamic industry professionals, this Dashboard Planner provides an expert-level data analysis at your fingertips.
🔍 **Distinct Features**:
💠 User-friendly interface: Navigate through your multiple streams of data with ease and make sense of your metrics in the most time-saving and seamless manner possible.
📈 Advanced Visualization: This Dynamic Dashboard employs sophisticated formulas to churn out tabulated data into visually appealing and easy-to-understand graphical representations.
✏️ Fully Customizable: Every cell, chart, and feature is customizable according to your specific need, making it a perfect fit for your unique research & development scenario.
⚙️ Automatic Calculation: Your productivity is our priority. This Excel Template will perform automatic calculations to save you from countless hours of manual entry.
🔧 Regularly Updated: To ensure you get the best of industry standards, our template is updated frequently to keep you ahead of your competition.
🌐 Multi-Industry Use: Whether you’re in Pharmaceuticals, Manufacturing, or IT, our template is designed to cover a broad range of industries.
📁 **Specifications**:
🖥️ Software Requirement: Microsoft Excel (Windows) or Numbers (Mac)
🗂️ Format: .xlsx File
⏬ Instant Digital Download: Yes
👥 This Dashboard Planner is perfect for all data enthusiasts, research analysts, industry professionals, and productivity-minded individuals who like to stay on top of their game.
🙏 Thank you for checking out my shop! If you have any questions, don’t hesitate to message me. Happy tracking! 🚀
$ 35 -

Energy Management KPI Dashboard Excel Template | Track & Analyze Energy Metrics | Monthly Cumulative Energy Performance Dashboard
Optimize your energy management with this Energy Management KPI Dashboard Excel Template.
For more details about the template, check the link below;
This powerful tool is designed for energy professionals and businesses looking to measure, compare, and analyze energy management KPIs month by month and cumulatively. Easily track your energy metrics, compare actual performance with target goals, and visualize data with dynamic charts that adjust based on your selected metrics. This Excel template is simple, intuitive, and easy to use, helping you make informed decisions that drive energy efficiency and cost savings.
Best for:
• Energy Suppliers
• Energy Industry
• Everyone starting with an energy new project
Content:
• Excel file compatible with Excel 2010 and higher (and with sample data)
• Professional Design
• Works both on Mac and Windows
• No installation needed. Ready to use
• Dashboard with charts
• Energy KPI Dashboard Template
• Easy to use
• 100% editable
• Excel file
• Instant download
• Friendly customer support for all your questions
License: Private Use (not for distribution or resale)
$ 35 -
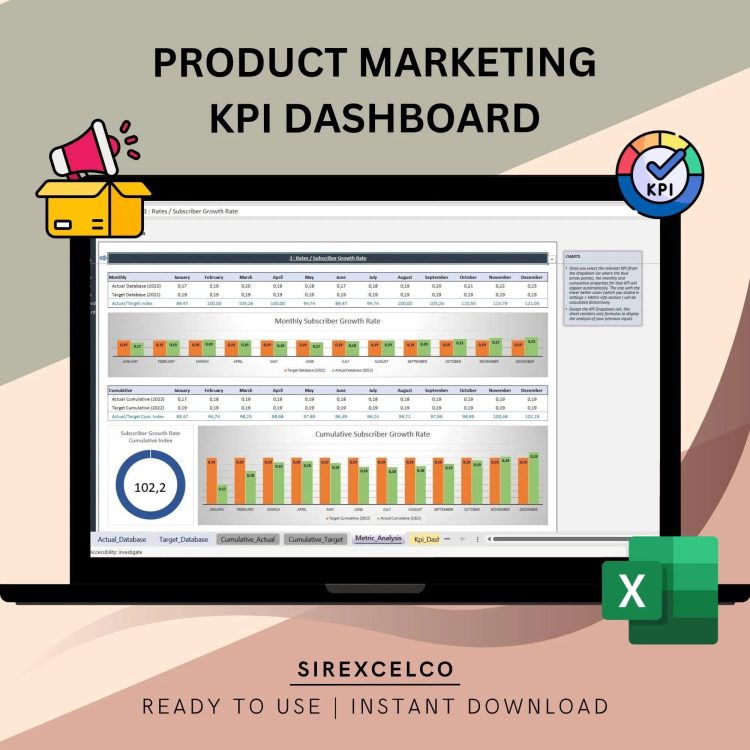
Product Marketing KPI Dashboard Excel Template | Dynamic Product Performance Tracker | Monthly & Cumulative Marketing KPI Analysis
Simplify your product marketing performance tracking with our Product Marketing KPI Dashboard Excel Template.
For more details about the template, check the link below;
This user-friendly Excel template allows marketers, product managers, and business owners to measure and compare key product marketing metrics month by month and cumulatively. Whether you need to track sales, customer acquisition, or campaign performance, this tool dynamically updates with interactive charts, letting you instantly compare target vs. actual metrics. Perfect for anyone looking to make data-driven decisions and improve marketing strategies, this template is designed for ease of use while providing deep insights into product performance.
What this means is that finding the right product marketing metrics is extremely crucial. Among the sea of options available, it’s important to identify which metrics are key to the success of your business. Otherwise, it’s easy to miss the wood for the trees and start tracking too much or too little.
Best for:
• Marketing Experts
• Product Marketers
• Everyone starting with a new project
Content:
• Excel file compatible with Excel 2010 and higher (and with sample data)
• Professional Design
• Works both on Mac and Windows
• No installation needed. Ready to use
• Dashboard with charts
• Product Management KPI Dashboard Template
• Easy to use
• 100% editable
• Excel file
• Instant download
• Friendly customer support for all your questions
License: Private Use (not for distribution or resale)
$ 35 -

DevOps KPI Dashboard Excel Template | Track Analyze DevOps Metrics | Monthly & Cumulative Performance | Dynamic Charts | Easy to Use
Elevate your DevOps performance tracking with the DevOps KPI Dashboard Excel Template.
For more details about the template, check the link below;
This user-friendly template allows you to measure and compare key DevOps metrics month by month, with cumulative analysis and dynamic charts that respond to selected metrics. Easily compare actual performance with target metrics to optimize your DevOps processes and workflow. Perfect for professionals looking to improve efficiency and track critical KPIs in their DevOps environment. Whether you’re focused on deployment, automation, or incident response, this template simplifies your data analysis, making it a must-have tool for any DevOps team.
Best for:
• DevOps
• Developers
• System Admins
Content:
• Excel file compatible with Excel 2010 and higher (and with sample data)
• Professional Design
• Works both on Mac and Windows
• No installation needed. Ready to use
• Dashboard with charts
• DevOps Kpi Dashboard Template
• Easy to use
• 100% editable
• Excel file
• Instant download
• Friendly customer support for all your questions
$ 35 -
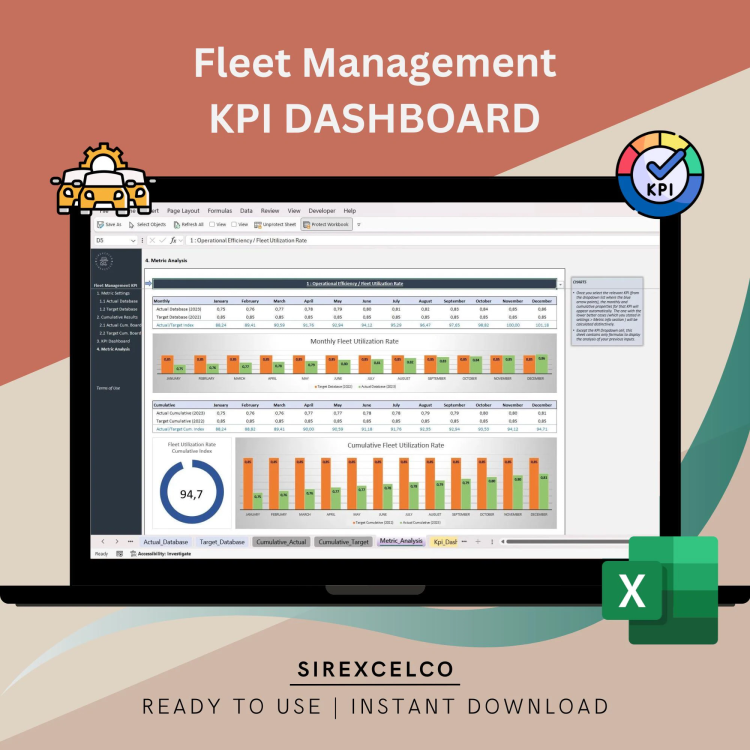
Fleet Management KPI Dashboard Excel Template, KPI Report, Dynamic Editable Performance Tracking Tool, Reporting File, Ready to Download
Keep your fleet operations running smoothly with this dynamic and editable Fleet Management KPI Dashboard Excel Template.
For more details about the template, check the link below;
Designed for fleet managers and logistics teams, this easy-to-use tool allows you to track key metrics like fuel efficiency, maintenance costs, vehicle utilization, and more—all in one place.
Fully customizable, you can tailor this dashboard to fit your unique fleet needs, helping you stay organized and make data-driven decisions to optimize performance. Whether you’re managing a small or large fleet, this template simplifies your reporting and keeps all your KPIs in clear view.
Perfect for fleet managers, logistics coordinators, and business owners who want an efficient way to monitor their fleet’s performance.
Key Features:
Fully editable and customizable Excel dashboard
Track essential fleet KPIs like fuel costs, maintenance, and utilization
Simple design for easy use, even without advanced Excel skills
Ready to download and start using immediately
Ideal for fleet managers, logistics teams, and operations departments
Content:
• Excel file compatible with Excel 2010 and higher (and with sample data)
• Professional Design
• Works both on Mac and Windows
• No installation needed. Ready to use
• Dashboard with charts
• Fleet Management KPI Dashboard Template
• Easy to use
• 100% editable
• Excel file
• Instant download
• Friendly customer support for all your questions
$ 35 -

CRM KPI Report Dashboard Excel Template | Dynamic Charts & Metrics | Track Monthly and Cumulative Performance
Take control of your CRM performance with this CRM KPI Report Dashboard Excel Template!
For more details about the template, check the link below;
Whether you’re looking to measure sales, customer engagement, or other key CRM metrics, this template helps you track performance month by month and cumulatively. With a simple input of data, you can compare target vs actual metrics and see the results in dynamic charts that update based on the metric you select.
This Excel template is designed for businesses, marketers, and data analysts who want to stay organized and make data-driven decisions. Easy to use and fully customizable, it requires no advanced Excel knowledge. Simply enter your CRM data, select the metric you want to analyze, and let the template do the rest!
Key Features:
Compare actual CRM performance vs target metrics
Track key CRM metrics on a monthly and cumulative basis
Dynamic charts that update based on selected metrics
User-friendly, no advanced Excel skills required
Perfect for tracking sales, customer interactions, and engagement
Fully customizable to suit your specific needs
This tool is ideal for those looking to improve CRM processes and make informed business decisions with ease.
Content:
• Excel file compatible with Excel 2010 and higher (and with sample data)
• Professional Design
• Works both on Mac and Windows
• No installation needed. Ready to use
• Dashboard with charts
• CRM KPI Dashboard Template
• Easy to use
• 100% editable
• Excel file
• Instant download
• Friendly customer support for all your questions
License: Private Use (not for distribution or resale)
$ 35 -
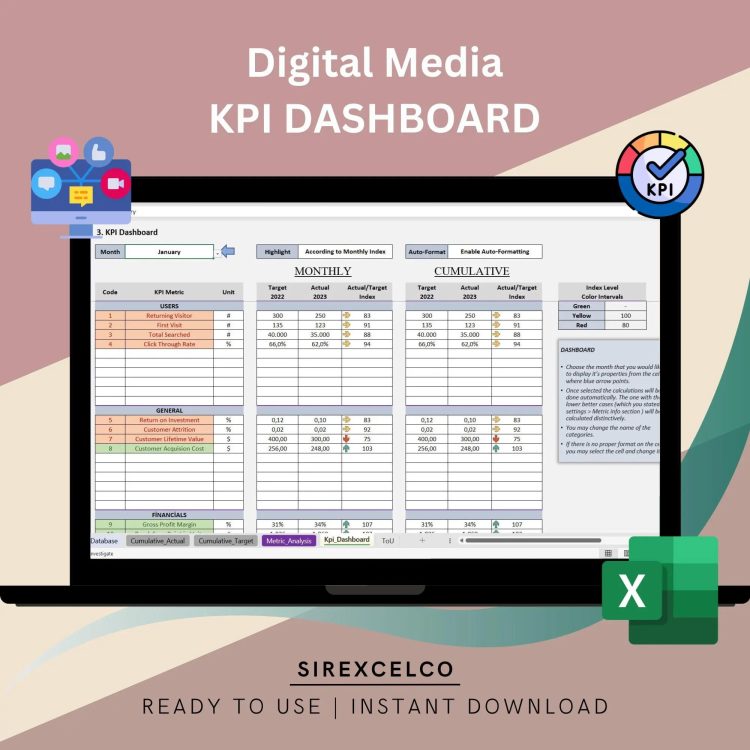
Digital Media KPI Report Excel Template | Track Monthly & Cumulative Metrics | Dynamic Charts and Performance Analysis
Track and optimize your digital media performance with this Digital Media KPI Report Excel Template!
For more details about the template, check the link below;
Whether you’re monitoring ad performance, engagement metrics, or overall digital media strategy, this template provides a clear, comprehensive view of your results. Compare your target metrics against actual performance, track progress month by month and cumulatively, and visualize your data with dynamic charts that automatically update based on your selected metric.
Ideal for digital marketers, content creators, and media managers, this template is incredibly easy to use—just enter your data, and the template takes care of the rest. No advanced Excel skills are needed, making it perfect for professionals looking to improve their digital media strategy with reliable, visual data analysis.
Key Features:
-Track digital media metrics on a monthly and cumulative basis
-Compare target vs actual performance
-Dynamic charts that adjust based on selected metrics
-Fully customizable and user-friendly
-Perfect for digital marketers, ad specialists, and content managers
-Requires no advanced Excel knowledge
-This template is an essential tool for anyone who wants to streamline their digital media performance tracking and make data-driven decisions with ease.
Material:
📝 Spreadsheet
🖥️ Microsoft Excel
📇 Excel Spreadsheet
📄 Excel Sheet
📑 Printable
🚦 Decision Making Tool
🔧 Decision Maker
🗂️ Organizing Tool
🌐 Google Sheets
⬇️ Digital Download
🎉 Easy to use
🎈 Ready to use
💹 KPI
Best for:
• Publishers
• Bloggers
• Everyone starting with a new project
Content:
• Excel file compatible with Excel 2010 and higher (and with sample data)
• Professional Design
• Works both on Mac and Windows
• No installation needed. Ready to use
• Dashboard with charts
• Digital Media KPI Dashboard Template
• Easy to use
• 100% editable
• Excel file
• Instant download
• Friendly customer support for all your questions
License: Private Use (not for distribution or resale)
$ 35 -

Social Media KPI Dashboard Excel Template | Track Social Media Metrics | Monthly & Cumulative Analysis | Dynamic Social Media Reports
Easily track and analyze your social media performance with this Social Media KPI Dashboard Excel Template.
For more details about the template, check the link below;
Ideal for marketers, influencers, and social media managers, this template helps you monitor your monthly and cumulative social media KPIs. Compare actual performance against target metrics, visualize data through dynamic charts, and gain insights to optimize your social media strategies. Whether you’re measuring engagement, growth, or content performance, this template makes managing your social media metrics simple and efficient.
Designed for marketers, influencers, and business owners, this template is incredibly user-friendly and requires no advanced Excel skills. Simply input your data, choose the metric you want to focus on, and the template will automatically generate charts to help you monitor your success.
Key Features:
Track social media metrics monthly and cumulatively
Compare target metrics vs actual performance
Dynamic charts that update based on selected metrics
User-friendly and fully customizable
Perfect for marketers, influencers, and social media managers
No advanced Excel knowledge needed
This template is an essential tool for anyone looking to improve their social media strategy and measure performance with accuracy.
Best for:
• Socal Media Experts
• Bloggers
• Everyone starting with a new project
• Marketing Experts
• Influencers
• Everyone opening a business
This tool will help you analyze your Monthly Kpi Metric data.
After you insert your Monthly Numeric data for the KPI Metrics you determine, you can see a clear monthly and cumulative analysis for the metrics you determine. It is also possible to compare your numeric data with your target data and past year data.
Seeing the level of difference of these metrics will help you identify the problem and how to improve your model more effectively and efficiently.
Content:
• Excel file compatible with Excel 2010 and higher (and with sample data)
• Professional Design
• Works both on Mac and Windows
• No installation needed. Ready to use
• Dashboard with charts
• Social Media KPI Dashboard Template
• Easy to use
• 100% editable
• Excel file
• Instant download
• Friendly customer support for all your questions
License: Private Use (not for distribution or resale)
Thanks for visiting!
$ 35