-

DevOps KPI Dashboard Excel Template | Track Analyze DevOps Metrics | Monthly & Cumulative Performance | Dynamic Charts | Easy to Use
Elevate your DevOps performance tracking with the DevOps KPI Dashboard Excel Template.
For more details about the template, check the link below;
This user-friendly template allows you to measure and compare key DevOps metrics month by month, with cumulative analysis and dynamic charts that respond to selected metrics. Easily compare actual performance with target metrics to optimize your DevOps processes and workflow. Perfect for professionals looking to improve efficiency and track critical KPIs in their DevOps environment. Whether you’re focused on deployment, automation, or incident response, this template simplifies your data analysis, making it a must-have tool for any DevOps team.
Best for:
• DevOps
• Developers
• System Admins
Content:
• Excel file compatible with Excel 2010 and higher (and with sample data)
• Professional Design
• Works both on Mac and Windows
• No installation needed. Ready to use
• Dashboard with charts
• DevOps Kpi Dashboard Template
• Easy to use
• 100% editable
• Excel file
• Instant download
• Friendly customer support for all your questions
$ 35 -

Dynamic Income Tracker Budget Excel Template | Track, Budget & Visualize Income by Type | Easy-to-Use with Customizable Reports
Dynamic Income Tracker Budget Excel Template
Discover the power of financial control with our Annual Budget Income Tracker 💪. This personal finance Budget Excel Template is designed to simplify your life by providing you a clear picture of your financial status ⚖️.
For more details about the template, check the link below;
Discover the power of financial control with our Annual Budget Income Tracker 💪. This personal finance Budget Excel Template is designed to simplify your life by providing you a clear picture of your financial status ⚖️.
🎯 Enjoy the convenience of an efficient budgeting system provided by the Monthly Financial Budget Planner Spreadsheet. It is user-friendly, easy to navigate, and versatile to suit your unique budgeting needs.
📊 Assists with precise record-keeping to track income, expenses, savings and more across an entire year. Understand at a glance where your hard-earned money is flowing to make better financial decisions.
🔧 Completely editable fields that lets you tailor your budget template to your personal preferences and requirements.
📈 Understand your cash flow better to save more and spend wisely. This powerful budget sheet empowers you to transition from living paycheck to paycheck to having a solid financial plan.
📝 Equipped with useful features like auto-calculations for ease of use and efficiency; saves time while budgeting.
🖥️ Crafted as an excel template ensuring its seamless use on any system or device that supports Microsoft Excel.
This Annual Budget Income Tracker | Personal Finance Budget Excel Template | Monthly Financial Budget Planner Spreadsheet is not just a tool, it’s the bridge to your financial independence and security, helping you reach your wealth goals 🌈💰.
Made to perfection, it represents your smart steps towards a financially stable and worry-free lifestyle.
Thank you for checking out my shop! 😊 I appreciate your support and interest in my products. If you have any questions or need further information, please don’t hesitate to contact me. Happy budgeting 🎉!
Take control of your finances with this easy-to-use Income Tracker and Budget Excel Template! Perfect for anyone wanting to track and budget their income across different types, this template offers a seamless way to view detailed reports. The dynamic charts adjust by date, allowing you to visualize your income data in real-time. Whether you’re a freelancer, small business owner, or someone looking to improve personal budgeting, this template makes financial management simple and effective. Fully customizable, it provides a powerful yet user-friendly solution to keep your finances organized.
Content:
• Excel file compatible with Excel 2007 and higher (and with sample data)
• Professional Design
• Works both on Mac and Windows
• No installation needed. Ready to use
• Annually Income Tracker Template
• Easy to use
• 100% editable
• Excel file
• Instant download
• Friendly customer support for all your questions
License: Private Use (not for distribution or resale)
$ 10 -
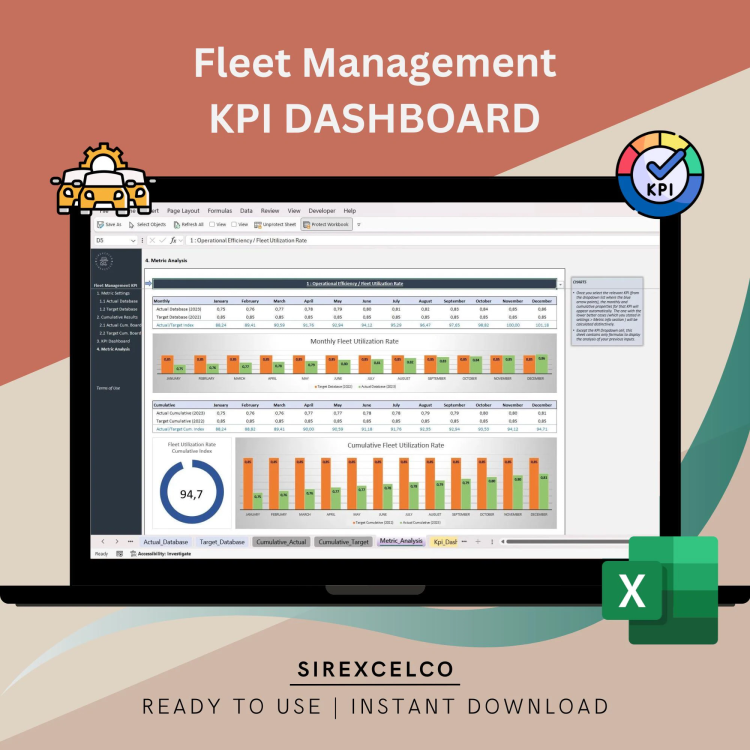
Fleet Management KPI Dashboard Excel Template, KPI Report, Dynamic Editable Performance Tracking Tool, Reporting File, Ready to Download
Keep your fleet operations running smoothly with this dynamic and editable Fleet Management KPI Dashboard Excel Template.
For more details about the template, check the link below;
Designed for fleet managers and logistics teams, this easy-to-use tool allows you to track key metrics like fuel efficiency, maintenance costs, vehicle utilization, and more—all in one place.
Fully customizable, you can tailor this dashboard to fit your unique fleet needs, helping you stay organized and make data-driven decisions to optimize performance. Whether you’re managing a small or large fleet, this template simplifies your reporting and keeps all your KPIs in clear view.
Perfect for fleet managers, logistics coordinators, and business owners who want an efficient way to monitor their fleet’s performance.
Key Features:
Fully editable and customizable Excel dashboard
Track essential fleet KPIs like fuel costs, maintenance, and utilization
Simple design for easy use, even without advanced Excel skills
Ready to download and start using immediately
Ideal for fleet managers, logistics teams, and operations departments
Content:
• Excel file compatible with Excel 2010 and higher (and with sample data)
• Professional Design
• Works both on Mac and Windows
• No installation needed. Ready to use
• Dashboard with charts
• Fleet Management KPI Dashboard Template
• Easy to use
• 100% editable
• Excel file
• Instant download
• Friendly customer support for all your questions
$ 35 -
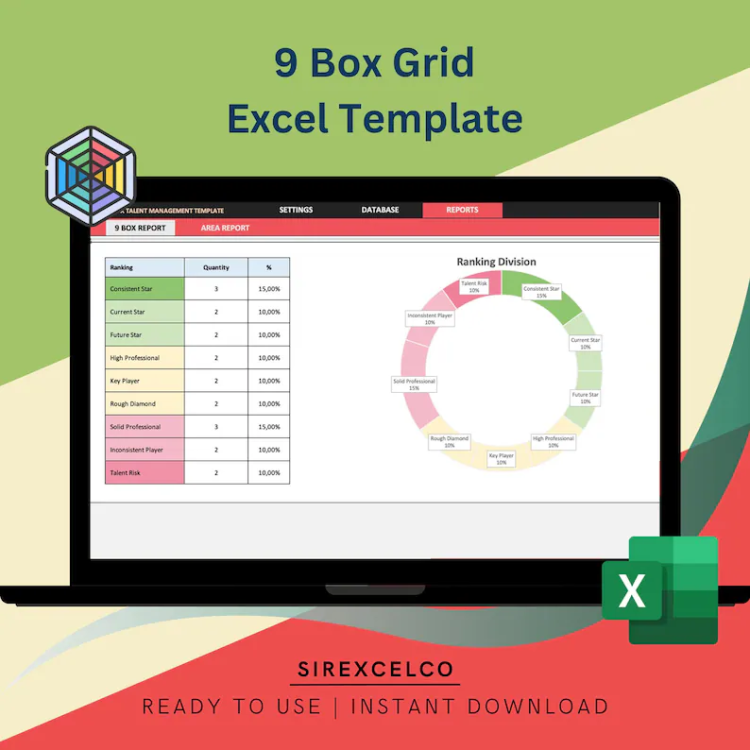
9 Box Grid Dashboard Excel Template | Employee Performance Potential Ranking | Talent Management | HR Assessment | Easy to Use
Enhance your talent management strategy with this 9-Box Grid Dashboard Excel Template.
For more details about the template, check the link below;
This tool enables managers and HR professionals to rank employees based on potential and performance, visualizing data with a 9-box grid framework. Ideal for tracking growth opportunities, assessing team dynamics, and developing succession plans. Simply input your data into an easy-to-use database, and the dynamic charts will display performance insights, making it an indispensable resource for employee evaluation and department analysis. A powerful and user-friendly tool for strategic workforce planning!
The 9-box grid is most commonly used in succession planning as a method of evaluating an organization’s current talent and identifying potential leaders. When leadership performance and potential are assessed and plotted on the graph, individuals in the upper right quadrant (Box 1) are identified as high-potential candidates for succession, while those in the lower left quadrant (Box 9) may need to be reassigned or removed from the organization.
The boxes on the grid indicate where investment needs to be made to develop future leaders. Those people in box 1 should be ready for top leadership within 6 months to a year; those in boxes 2, 3, or 6 have a longer timeline but can be groomed for eventual movement to box 1.
A useful tool for analyzing and visualizing data is the 9 Box Grid. You can quickly and simply create beautiful, interactive dashboards that bring your data to life using this template.
This template is perfect for managers, business owners, and data analysts who need to use their data to make decisions. It’s the ideal solution for anyone who wants to advance their data analysis because to its user-friendly interface and robust functionality.
Get hold of the 9 Box Grid Dashboard Excel Template right away to start utilizing your data to its full potential!
Best for:
• Talent Professionals
• HR Professionals
• All types of companies
Content:
• Excel file compatible with Excel 2007 and higher (and with sample data)
• Professional Design
• Works both on Mac and Windows
• No installation needed. Ready to use
• Dashboard with charts
• 9 Box Grid Assessment Dashboard Template
• Easy to use
• 100% editable
• Excel file
• Instant download
• Friendly customer support for all your questions
License: Private Use (not for distribution or resale)
$ 11 -

Pestle Analysis Template | Excel Template | Business Tool Project Planner | Project Management Analysis Tool
PESTLE Analysis Template
Are you looking for a hassle-free way to analyze your business operations and plan your projects? Look no further than the PESTLE Excel Template from Sirexcelco! Our expertly designed spreadsheet is perfect for businesses of all sizes looking to streamline their project planning and stay ahead of the game.
The PESTLE Excel Template boasts a sleek, modern design with carefully chosen colors to ensure a pleasant user experience. Our easy-to-use interface allows users to input their issues with ease, while the automatic task numbering system takes the stress out of keeping track of your progress.
Content:
• Excel file compatible with Excel 2007 and higher (and with sample data)
• Professional Design
• Works both on Mac and Windows
• No installation needed. Ready to use
• Pestle Analysis Template
• Easy to use
• 100% editable
• Excel file
• Instant download
• Friendly customer support for all your questions
License: Private Use (not for distribution or resale)
$ 5 -

CRM KPI Report Dashboard Excel Template | Dynamic Charts & Metrics | Track Monthly and Cumulative Performance
Take control of your CRM performance with this CRM KPI Report Dashboard Excel Template!
For more details about the template, check the link below;
Whether you’re looking to measure sales, customer engagement, or other key CRM metrics, this template helps you track performance month by month and cumulatively. With a simple input of data, you can compare target vs actual metrics and see the results in dynamic charts that update based on the metric you select.
This Excel template is designed for businesses, marketers, and data analysts who want to stay organized and make data-driven decisions. Easy to use and fully customizable, it requires no advanced Excel knowledge. Simply enter your CRM data, select the metric you want to analyze, and let the template do the rest!
Key Features:
Compare actual CRM performance vs target metrics
Track key CRM metrics on a monthly and cumulative basis
Dynamic charts that update based on selected metrics
User-friendly, no advanced Excel skills required
Perfect for tracking sales, customer interactions, and engagement
Fully customizable to suit your specific needs
This tool is ideal for those looking to improve CRM processes and make informed business decisions with ease.
Content:
• Excel file compatible with Excel 2010 and higher (and with sample data)
• Professional Design
• Works both on Mac and Windows
• No installation needed. Ready to use
• Dashboard with charts
• CRM KPI Dashboard Template
• Easy to use
• 100% editable
• Excel file
• Instant download
• Friendly customer support for all your questions
License: Private Use (not for distribution or resale)
$ 35 -
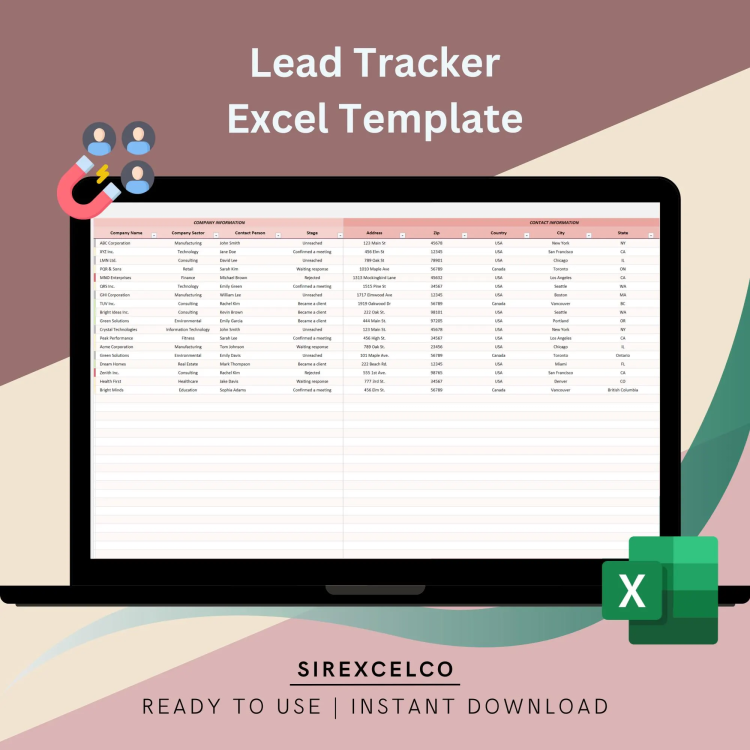
Lead Tracker Excel Template, Printable Customer Follow Up Google Sheet, Cold Call Tracker, Sales Activity Excel
Lead Tracker Excel Template
Introducing our premium Lead List Excel Template – the ultimate tool for businesses looking to improve their sales strategies and increase revenue. Our template is designed to help you efficiently manage your lead list, organize your sales data and track your progress towards your sales goals.
With our Lead List Excel Template, you can easily enter and edit all of your lead information in one place. From company name and sector to contact person and contact details, our user-friendly template allows you to manage all your leads in a clear and organized manner.
Our Excel template also comes equipped with a range of features to help you analyze your sales data and make informed decisions. You can track the status of each lead, from unreached to confirmed meeting, and use the data to measure your sales performance and identify areas for improvement.
The template is fully customizable to suit the unique needs of your business. You can add or remove columns, customize the formatting, and easily import or export data to other platforms.
Content:
• Excel file compatible with Excel 2007 and higher (and with sample data)
• Professional Design
• Works both on Mac and Windows
• No installation needed. Ready to use
• Dashboard with charts
• Lead Tracker Excel Template
• Easy to use
• 100% editable
• Excel file
• Instant download
• Friendly customer support for all your questions
License: Private Use (not for distribution or resale)
$ 5 -

Editable Invoice Excel Template | Printable Business Invoice | Small Business Invoice form | With Contact Database | Photography Invoice
Utilize our Editable Invoice Excel Template to streamline your billing procedure!
For more details about the template, check the link below;
By automating the invoicing process and offering a complete database to hold all your client information, this robust template is made to simplify your life. You can quickly and easily create expert invoices that appropriately represent your business thanks to its user-friendly design.
You can customize the template’s many editable fields to make your invoice design speak to your unique requirements. All of your client data is conveniently and securely stored in the built-in customer database, making it accessible anytime you need it.
This template is the ideal tool to help you manage your invoicing process, whether you’re a small business owner, freelancer, or consultant.
Get hold of the Excel invoice template right away to get the most out of your billing procedure and create a Professional Invoice.
Content:
• Excel file compatible with Excel 2007 and higher (and with sample data)
• Professional Design
• Works both on Mac and Windows
• No installation needed. Ready to use
• Invoice Excel Template
• Easy to use
• 100% editable
• Excel file
• Instant download
• Friendly customer support for all your questions
License: Private Use (not for distribution or resale)
Thanks for visiting!
$ 6 -
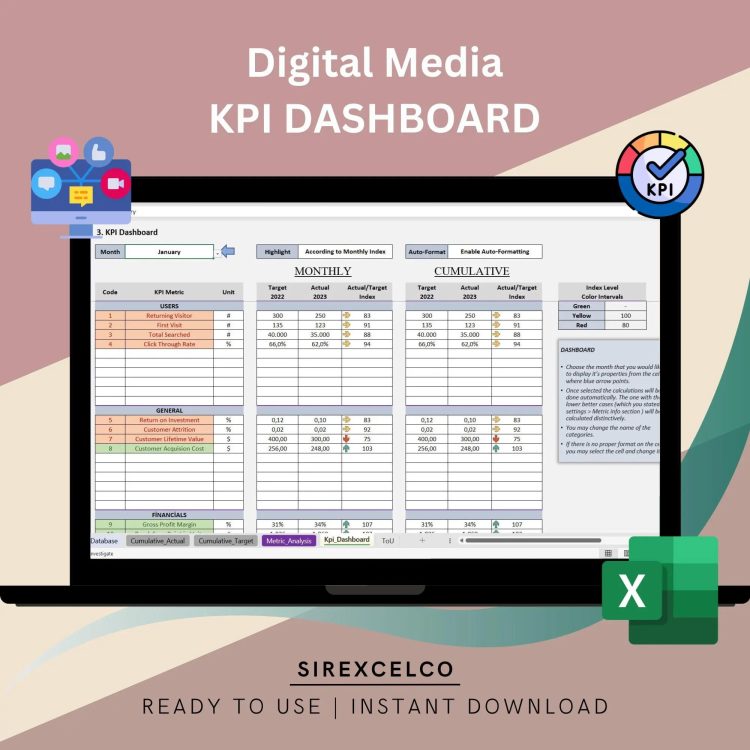
Digital Media KPI Report Excel Template | Track Monthly & Cumulative Metrics | Dynamic Charts and Performance Analysis
Track and optimize your digital media performance with this Digital Media KPI Report Excel Template!
For more details about the template, check the link below;
Whether you’re monitoring ad performance, engagement metrics, or overall digital media strategy, this template provides a clear, comprehensive view of your results. Compare your target metrics against actual performance, track progress month by month and cumulatively, and visualize your data with dynamic charts that automatically update based on your selected metric.
Ideal for digital marketers, content creators, and media managers, this template is incredibly easy to use—just enter your data, and the template takes care of the rest. No advanced Excel skills are needed, making it perfect for professionals looking to improve their digital media strategy with reliable, visual data analysis.
Key Features:
-Track digital media metrics on a monthly and cumulative basis
-Compare target vs actual performance
-Dynamic charts that adjust based on selected metrics
-Fully customizable and user-friendly
-Perfect for digital marketers, ad specialists, and content managers
-Requires no advanced Excel knowledge
-This template is an essential tool for anyone who wants to streamline their digital media performance tracking and make data-driven decisions with ease.
Material:
📝 Spreadsheet
🖥️ Microsoft Excel
📇 Excel Spreadsheet
📄 Excel Sheet
📑 Printable
🚦 Decision Making Tool
🔧 Decision Maker
🗂️ Organizing Tool
🌐 Google Sheets
⬇️ Digital Download
🎉 Easy to use
🎈 Ready to use
💹 KPI
Best for:
• Publishers
• Bloggers
• Everyone starting with a new project
Content:
• Excel file compatible with Excel 2010 and higher (and with sample data)
• Professional Design
• Works both on Mac and Windows
• No installation needed. Ready to use
• Dashboard with charts
• Digital Media KPI Dashboard Template
• Easy to use
• 100% editable
• Excel file
• Instant download
• Friendly customer support for all your questions
License: Private Use (not for distribution or resale)
$ 35 -

Social Media KPI Dashboard Excel Template | Track Social Media Metrics | Monthly & Cumulative Analysis | Dynamic Social Media Reports
Easily track and analyze your social media performance with this Social Media KPI Dashboard Excel Template.
For more details about the template, check the link below;
Ideal for marketers, influencers, and social media managers, this template helps you monitor your monthly and cumulative social media KPIs. Compare actual performance against target metrics, visualize data through dynamic charts, and gain insights to optimize your social media strategies. Whether you’re measuring engagement, growth, or content performance, this template makes managing your social media metrics simple and efficient.
Designed for marketers, influencers, and business owners, this template is incredibly user-friendly and requires no advanced Excel skills. Simply input your data, choose the metric you want to focus on, and the template will automatically generate charts to help you monitor your success.
Key Features:
Track social media metrics monthly and cumulatively
Compare target metrics vs actual performance
Dynamic charts that update based on selected metrics
User-friendly and fully customizable
Perfect for marketers, influencers, and social media managers
No advanced Excel knowledge needed
This template is an essential tool for anyone looking to improve their social media strategy and measure performance with accuracy.
Best for:
• Socal Media Experts
• Bloggers
• Everyone starting with a new project
• Marketing Experts
• Influencers
• Everyone opening a business
This tool will help you analyze your Monthly Kpi Metric data.
After you insert your Monthly Numeric data for the KPI Metrics you determine, you can see a clear monthly and cumulative analysis for the metrics you determine. It is also possible to compare your numeric data with your target data and past year data.
Seeing the level of difference of these metrics will help you identify the problem and how to improve your model more effectively and efficiently.
Content:
• Excel file compatible with Excel 2010 and higher (and with sample data)
• Professional Design
• Works both on Mac and Windows
• No installation needed. Ready to use
• Dashboard with charts
• Social Media KPI Dashboard Template
• Easy to use
• 100% editable
• Excel file
• Instant download
• Friendly customer support for all your questions
License: Private Use (not for distribution or resale)
Thanks for visiting!
$ 35 -

Marketing KPI Report Excel Template | Track Monthly & Cumulative Metrics | Dynamic Charts and Performance Analysis
Take control of your marketing performance with this Marketing KPI Report Excel Template!
For more details about the template, check the link below;
Whether you’re monitoring campaign success, lead generation, or engagement metrics, this template offers a powerful way to track your marketing metrics month by month and cumulatively. You can easily compare target vs actual results and visualize your progress through dynamic charts that automatically update based on the metric you select.
Perfect for marketers, business owners, and marketing professionals, this template requires no advanced Excel skills and is fully customizable to meet your needs. Simply input your data and watch the template do the heavy lifting, helping you make informed, data-driven decisions to improve your marketing efforts.
Key Features:
Track marketing metrics on a monthly and cumulative basis
Compare target vs actual performance
Dynamic charts that update with chosen metrics
User-friendly and easy to customize
Ideal for marketers, business owners, and marketing teams
No advanced Excel skills required
This template is an essential tool for anyone looking to streamline their marketing reporting and make data-backed decisions.
Content:
• Excel file compatible with Excel 2010 and higher (and with sample data)
• Professional Design
• Works both on Mac and Windows
• No installation needed. Ready to use
• Dashboard with charts
• Marketing Kpi Dashboard Excel Template
• Easy to use
• 100% editable
• Excel file
• Instant download
• Friendly customer support for all your questions
License: Private Use (not for distribution or resale)
$ 35 -
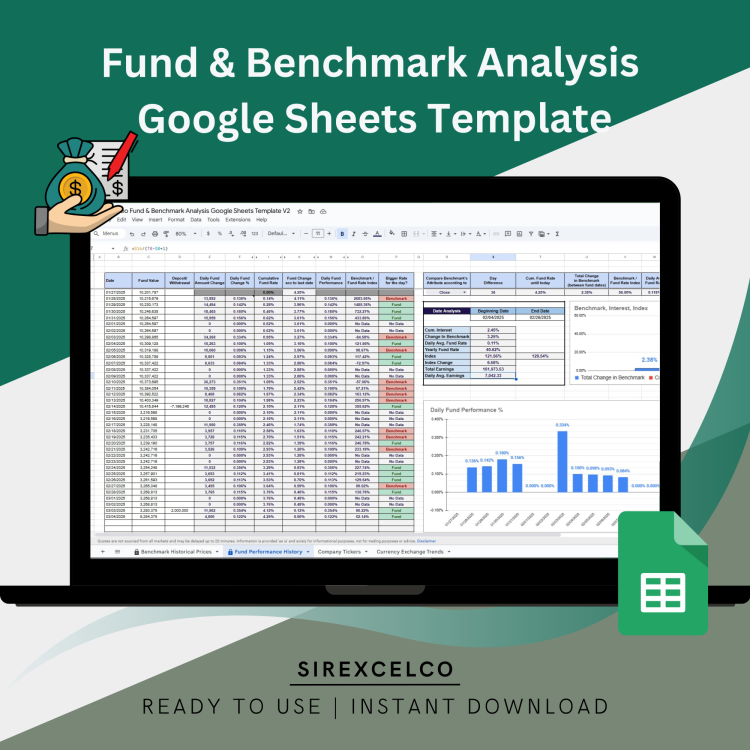
Fund & Benchmark Analysis Google Sheets Template | Investment Analytics | Performance Tracking | Compare Funds with Custom Benchmarks
Easily track your investment performance with this Google Sheets Fund Performance Tracker.
For more details about the template, check the link below;
This dynamic and easy-to-use template helps investors analyze their fund’s daily performance while comparing it to a custom benchmark—whether it’s a currency, stock, or mutual fund. Get insights on Cumulative Interest, Benchmark Changes, Daily & Yearly Fund Rates, Total Earnings, and more. Simply enter your data, and the template automatically generates key analytics and comparisons. Perfect for investors looking for a structured and insightful way to monitor and optimize their portfolio performance.
$ 40