- “Culinary Arts Academy – 10 Year Financial Model” already exists in your wishlist
-
-
OpEx-Six Sigma – Improve Process Capability
Process Capability
This source outlines a three-session programme focused on determining and improving process capability, often associated with Six Sigma methodologies. The initial session introduces the process model, the relationship between Key Process Input Variables (KPIV) and Key Process Output Variables (KPOV), and the importance of measurements, including the concept of normal distribution and 3-Sigma vs 6-Sigma performance. Participants engage in an exercise using a catapult (X-Pult) to identify process variables and collect data. The second session reviews control charts, distinguishing between common cause and special cause variation, and explains process capability through the Cpk index. The final session concentrates on root cause analysis, developing improvement action plans, and implementing these changes, again using the catapult exercise to demonstrate measurable improvements in process capability.$ 49$ 54 -

Pestle Analysis Template | Excel Template | Business Tool Project Planner | Project Management Analysis Tool
PESTLE Analysis Template
Are you looking for a hassle-free way to analyze your business operations and plan your projects? Look no further than the PESTLE Excel Template from Sirexcelco! Our expertly designed spreadsheet is perfect for businesses of all sizes looking to streamline their project planning and stay ahead of the game.
The PESTLE Excel Template boasts a sleek, modern design with carefully chosen colors to ensure a pleasant user experience. Our easy-to-use interface allows users to input their issues with ease, while the automatic task numbering system takes the stress out of keeping track of your progress.
Content:
• Excel file compatible with Excel 2007 and higher (and with sample data)
• Professional Design
• Works both on Mac and Windows
• No installation needed. Ready to use
• Pestle Analysis Template
• Easy to use
• 100% editable
• Excel file
• Instant download
• Friendly customer support for all your questions
License: Private Use (not for distribution or resale)
$ 5 -
Prince2 & Agile Excel RAID log template, track project Risks, Assumptions, Issues, Dependencies (plus other key logs)
Prince2 & Agile Excel RAID log template to track Risks, Assumptions, Issues, Dependencies & more. Editable, comprehensive & ideal for project managers.
$ 30$ 40 -
Prince2 & Agile Weekly / Monthly Project Status Report for Client / Internal reporting of Project Health, 3 formats
Prince2 & Agile project status report template in 3 PPT formats. Ideal for client & internal reporting of project health, risks, milestones & progress.
$ 30$ 40 -
PRINCE2 7th Edition Planner MS Templates Download – Both Microsoft Project MPP msp & ms Excel and Word Formats – Prince2
PRINCE2 7th Edition MS Templates Download – Microsoft Project MPP msp ms Excel and Word Formats – Prince2 Template Toolkit
$ 40$ 50 -
Private School Business Plan Template
Explore the comprehensive Private School Business Plan template from Oak Business Consultant. Crafted for educational institutions, our business plan provides strategic insights, financial projections, and a roadmap for success.
$ 250$ 280Private School Business Plan Template
$ 250$ 280 -

Private School – 10 Year Financial Model
A 10-Year Financial Model for a startup or existing Private School designed to optimize budgeting, forecasting, and financial planning. This model provides a clear, data-driven framework to manage tuition revenue, operational costs, staff salaries, and capital expenditures. With built-in scenario analysis and key performance indicators, it empowers school administrators to make informed financial decisions, ensuring long-term sustainability and growth.
$ 109 -

Procurement KPI Report Excel Template | Dynamic Monthly & Cumulative Metrics Tracking | Target vs Actual Performance Dashboard
Introducing our uniquely designed “Procurement KPI Dashboard | Procurement Excel KPI Report Template | Dynamic Reporting Dashboard | Performance Tracking Report”.
A meticulously crafted, dynamic reporting tool that is guaranteed to transform the way you plan and streamline your processes. Engineered using Microsoft Excel and Google Sheets, this digital download is more than just an Excel Spreadsheet: it’s your new decision-making ally.
For more details about the template, check the link below;
Introducing our uniquely designed “Procurement KPI Dashboard | Procurement Excel KPI Report Template | Dynamic Reporting Dashboard | Performance Tracking Report”. A meticulously crafted, dynamic reporting tool that is guaranteed to transform the way you plan and streamline your processes. Engineered using Microsoft Excel and Google Sheets, this digital download is more than just an Excel Spreadsheet: it’s your new decision-making ally.
✨Instant Download: No waiting needed. Have access to your dashboard planner immediately after your purchase.
📊Dashboard Excel: Enables you to view and manage a large amount of data seamlessly.
🔑Procurement KPI: Track multiple performance metrics all in one place – ensuring maximum efficiency.
📝Excel KPI Report Template: Create detailed reports quicker and easier, so you can focus on strategizing.
🎯Performance Tracker: Keep tabs on any progress, identify trends and reach your objectives faster.
📑Excel Template: High-quality templates designed for ease of use, adaptability, and accuracy.
Product Specifications:
💽File Type: XLSX
📈Form/Template: Excel Spreadsheet, Excel Sheet
✅Requirement: Microsoft Excel
💻Compatibility: Google Sheets
🏷️Function: Printable, Decision Making Tool, Decision Maker, Organizing Tool
🌐Access: Fully accessible and easy to use.
Boost your procurement efficiency with our Procurement KPI Report Excel Template! This dynamic and easy-to-use tool is designed to track key procurement metrics month by month and cumulatively, comparing target metrics with actual performance. Whether you’re monitoring supplier performance, cost control, or purchasing efficiency, this template simplifies procurement tracking with dynamic charts that adjust based on the selected metric. Ideal for procurement managers and business owners, it provides real-time insights for better decision-making and improved procurement operations.
Content:
• Excel file compatible with Excel 2010 and higher (and with sample data)
• Professional Design
• Works both on Mac and Windows
• No installation needed. Ready to use
• Dashboard with charts
• Procurement KPI Dashboard Template
• Easy to use
• 100% editable
• Excel file
• Instant download
• Friendly customer support for all your questions
License: Private Use (not for distribution or resale)
$ 35 -
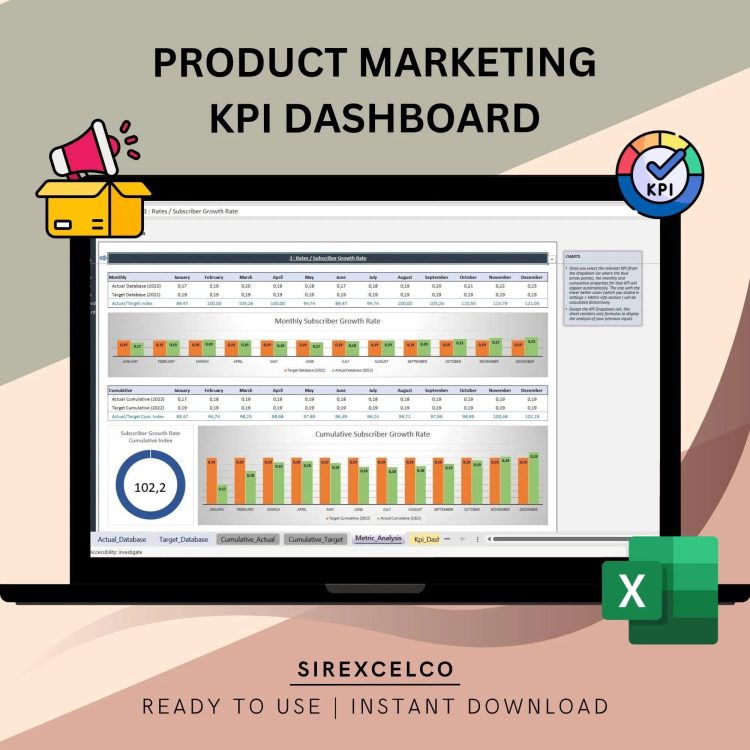
Product Marketing KPI Dashboard Excel Template | Dynamic Product Performance Tracker | Monthly & Cumulative Marketing KPI Analysis
Simplify your product marketing performance tracking with our Product Marketing KPI Dashboard Excel Template.
For more details about the template, check the link below;
This user-friendly Excel template allows marketers, product managers, and business owners to measure and compare key product marketing metrics month by month and cumulatively. Whether you need to track sales, customer acquisition, or campaign performance, this tool dynamically updates with interactive charts, letting you instantly compare target vs. actual metrics. Perfect for anyone looking to make data-driven decisions and improve marketing strategies, this template is designed for ease of use while providing deep insights into product performance.
What this means is that finding the right product marketing metrics is extremely crucial. Among the sea of options available, it’s important to identify which metrics are key to the success of your business. Otherwise, it’s easy to miss the wood for the trees and start tracking too much or too little.
Best for:
• Marketing Experts
• Product Marketers
• Everyone starting with a new project
Content:
• Excel file compatible with Excel 2010 and higher (and with sample data)
• Professional Design
• Works both on Mac and Windows
• No installation needed. Ready to use
• Dashboard with charts
• Product Management KPI Dashboard Template
• Easy to use
• 100% editable
• Excel file
• Instant download
• Friendly customer support for all your questions
License: Private Use (not for distribution or resale)
$ 35 -
Programme, Project Benefits Realization Tracker MS Template for Recording & Tracking project benefits, baseline & status
MS Excel template for Programme & Project Benefits Realization tracking. Record benefits, baselines, targets & RAG status to monitor project outcomes.
$ 30$ 40