-

Dynamic CRM Excel Template | All-in-One CRM Software Solution | Salesman Analysis | Track, Manage, & Visualize CRM Data | Easy-to-Use
Dynamic CRM Excel Template
Looking for a CRM solution without the need for complex software? This dynamic CRM Excel template is the perfect tool for tracking and managing your customer data with ease! It offers everything a CRM software does, right within Excel.
For more details about the template, check the link below;
With dynamic charts that automatically adjust based on dates, you’ll have real-time insights at your fingertips. It’s customizable, easy to use, and gives you full control over your customer relationships. Whether you’re a small business owner or a freelancer, this Excel template simplifies CRM management and helps you stay organized, all while keeping your data in one place. Perfect for users looking for flexibility and power without the high cost of traditional CRM software.
Content:
• Excel file compatible with Excel 2010 and higher (and with sample data)
• Professional Design
• Works both on Mac and Windows
• No installation needed. Ready to use
• Dashboard with charts
• CRM Excel Template
• Easy to use
• 100% editable
• Excel file
• Instant download
• Friendly customer support for all your questions
License: Private Use (not for distribution or resale)
✨Explore the exquisite design of our robust and versatile CRM Excel Template, your ultimate guide for smart customer relationship management. Handcrafted expressly for you to manage and track your customer database and leads with ease and style. 🧩
🔮 Features:
👥 A comprehensive Customer Database to store all your client’s information
📊 A CRM Dashboard Excel to monitor and analyse data intuitively
🏠 Ideal CRM for Realtors to handle contacts, track leads, and manage interactions
📑 Seamlessly integrates with CRM Google Sheet, simplifying data entry and analysis
🎁 An all-in-one CRM Template that is easy to use and adaptable to your business needs
💟 A CRM Tracker that helps you to accurately monitor sales activities
🚀 Specifically designed as a Track Customer Spreadsheet to maintain a clean and organized database
👑 Extraordinarily detailed, our CRM Excel Template offers the perfect blend of utility and elegance, making it an invaluable tool for any thriving business! 🧲
$ 20 -

Risk Management KPI Dashboard Excel Template, Excel Risk Metrics Report Template Digital File, Risk Assessment Dynamic Reporting Tracker
Risk Management KPI Dashboard
Introducing our cutting-edge “Risk Management KPI Dashboard | Excel Risk Metrics Report Template | Dynamic Analytics Tool | Decision-Making Companion.” This meticulously crafted, dynamic reporting tool is poised to revolutionize the way you navigate and optimize your risk management processes.
For more details about the template, check the link below;
Crafted with precision using Microsoft Excel and Google Sheets, this digital download transcends the boundaries of a typical spreadsheet – it’s your strategic ally in decision-making.
✨Instant Download: No waiting required. Access your dashboard immediately after purchase.
📊Excel Dashboard: Effortlessly view and manage a wealth of data for comprehensive risk analysis.
📉Risk Management KPI: Track multiple key performance indicators in a centralized location for maximum efficiency.
📝Metrics Report Template: Streamline the creation of detailed reports, allowing you to focus on strategic planning.
🎯Dynamic Analytics Tool: Monitor progress, identify trends, and achieve your risk management objectives with ease.
📑Excel Template: Top-notch design for user-friendly experience, adaptability, and accuracy.
Product Specifications:
💽File Type: XLSX
📈Form/Template: Excel Spreadsheet, Excel Sheet
✅Requirement: Microsoft Excel
💻Compatibility: Google Sheets
🏷️Function: Printable, Decision Making Tool, Data Organizer, Analytics Tool
🌐Access: Fully accessible and easy to use.
Craftsmanship: This isn’t just an Excel sheet; it’s a robust planning tool with meticulous attention to detail. Every element is carefully designed to ensure your success. The tool is easily customizable to suit your exact needs and built to evolve with your risk management strategies.
Digital Materials: Spreadsheet, Microsoft Excel, Excel Spreadsheet, Excel Sheet, Printable, Decision Making Tool, Analytics Tool, Google Sheets, Easy to Use, XLSX, Excel.
Thank you for choosing our product. Your success is a testament to our commitment to creating impactful tools. We appreciate your choice and honor the craftsmanship that goes into developing our products.
Make sure to explore other innovative products in our shop – each meticulously designed to support and enhance your projects. Take your time, and you’ll discover numerous tools to assist, inspire, and elevate your risk management endeavors. Wishing you abundant success!
$ 35 -

SEO KPI Dashboard Excel Template | Dynamic Monthly & Cumulative SEO Metrics Tracking | Target vs Actual Performance Report Analysis
Take control of your SEO performance with our SEO KPI Dashboard Excel Template!
This powerful, easy-to-use tool is designed to track essential SEO metrics month by month and cumulatively, providing you with a clear comparison of target vs actual performance.
For more details about the template, check the link below;
The dynamic charts adjust based on the metric you select, making data visualization quick and intuitive. Whether you’re focusing on keyword ranking, organic traffic, or backlinks, this template helps you make data-driven decisions to improve your SEO strategy. Perfect for marketers, SEO specialists, and business owners.
Key Features:
Dynamic and fully editable Excel dashboard
Tracks important SEO KPIs including traffic, rankings, and backlinks
Customizable design to fit your needs
Easy-to-use for all experience levels
Perfect for SEO professionals, agencies, and website owners
Content:
• Excel file compatible with Excel 2010 and higher (and with sample data)
• Professional Design
• Works both on Mac and Windows
• No installation needed. Ready to use
• Dashboard with charts
• SEO KPI Dashboard
• Easy to use
• 100% editable
• Excel file
• Instant download
• Friendly customer support for all your questions
License: Private Use (not for distribution or resale)
$ 35 -
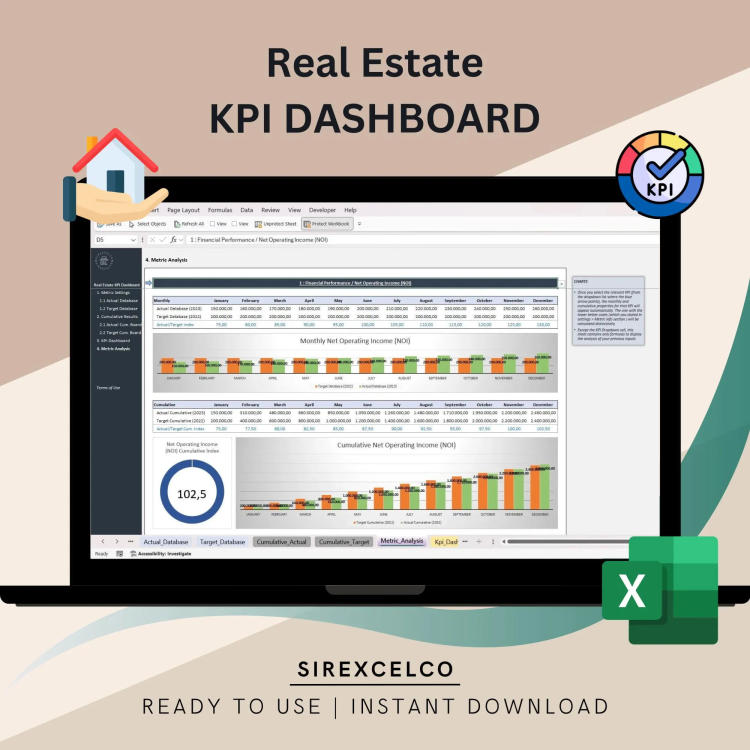
Real Estate KPI Dashboard Excel Template | Dynamic Real Estate Performance Tracker | Monthly & Cumulative KPI Metrics Analysis
Easily track and compare your real estate KPI metrics with our Real Estate KPI Dashboard Excel Template.
For more details about the template, check the link below;
Designed for property managers, real estate professionals, and homeowners, this dynamic Excel template lets you monitor key performance indicators month by month and cumulatively. Compare actual results with target metrics, all represented through customizable dynamic charts. Whether you’re tracking property sales, occupancy rates, or financial performance, this tool provides clear data insights to help optimize your real estate investments. It’s simple to use, making complex performance tracking easier than ever.
With a fully customizable layout, you can tailor the dashboard to suit your specific needs and goals. Monitor your portfolio’s performance and make informed decisions using clear, organized data—all in one place.
Whether you’re managing multiple properties or just getting started, this template will save you time and provide insights that help you grow your business.
Key Features:
Dynamic and fully editable Excel dashboard
Tracks essential real estate KPIs like revenue, occupancy, and expenses
Customizable for any property type or portfolio size
Simple to use, even if you’re not an Excel expert
Ideal for property managers, real estate investors, and agents
Content:
• Excel file compatible with Excel 2010 and higher (and with sample data)
• Professional Design
• Works both on Mac and Windows
• No installation needed. Ready to use
• Dashboard with charts
• Real Estate KPI Dashboard
• Easy to use
• 100% editable
• Excel file
• Instant download
• Friendly customer support for all your questions
License: Private Use (not for distribution or resale)
$ 35 -

Advanced To Do List Excel Template | Digital Daily Planner | Printable Productivity Planner | Monthly To-Do List | | Editable Spreadsheet
Introducing the Advanced To Do List Excel Template by Sirexcelco – your ultimate solution for efficient task management and productivity enhancement.
For more details about the template, check the link below;
This comprehensive Excel template empowers you to effortlessly organize your tasks, track their status, and prioritize them with ease. With its user-friendly interface, you can seamlessly input your tasks, update their progress, and assign priority levels, all within a single sheet.
But that’s not all! Our Advanced To Do List Excel Template takes task management to the next level. With built-in analysis features, you can generate insightful summaries and gain valuable insights based on your chosen month, year, or even your entire task history. This means you can now identify trends, evaluate your progress, and make data-driven decisions to optimize your workflow.
Whether you’re a digital planner enthusiast, a productivity enthusiast, or simply someone seeking a powerful organizational tool, this template has got you covered. It’s the perfect blend of a To Do List, Digital Planner, Daily Planner, Weekly Planner, and Monthly Planner, all packed into one convenient package.
Forget about cumbersome paper planners or limited digital alternatives. With our Advanced To Do List Excel Template, you’ll have the flexibility to adapt to your unique needs and stay on top of your tasks like never before.
Don’t miss out on this incredible opportunity to boost your productivity and streamline your task management process. Get your hands on this digital download, excel tracker, and excel spreadsheet today and experience the difference for yourself.
Content:
• Excel file compatible with Excel 2010 and higher (and with sample data)
• Professional Design
• Works both on Mac and Windows
• No installation needed. Ready to use
• Dashboard with charts
• To Do List Excel Template
• Easy to use
• 100% editable
• Excel file
• Instant download
• Friendly customer support for all your questions
License: Private Use (not for distribution or resale)
$ 15 -
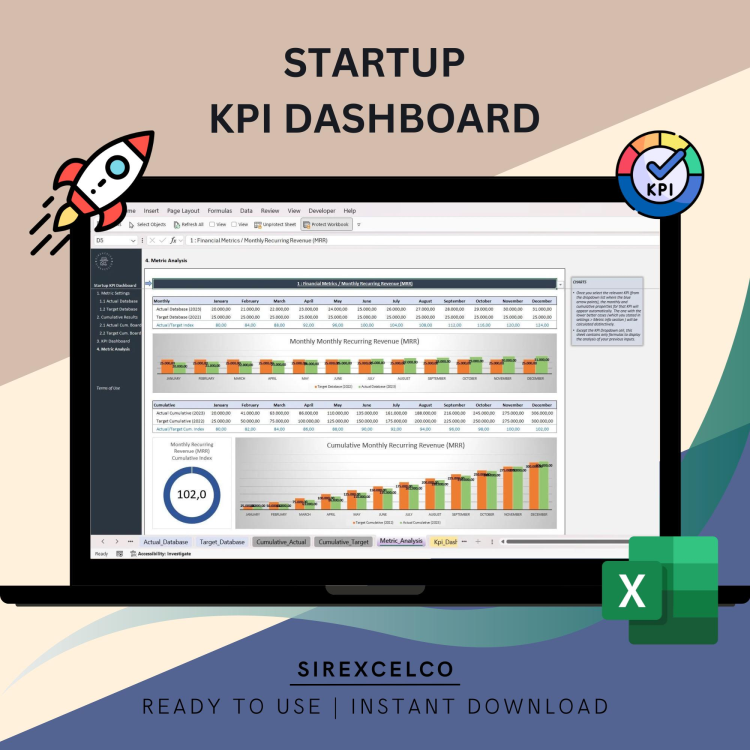
Startup KPI Dashboard Excel Template | Dynamic Monthly & Cumulative KPI Metrics Tracker | Target vs Actual Performance Analysis
Monitor your startup’s key performance indicators effortlessly with our Startup KPI Dashboard Excel Template.
This easy-to-use, dynamic tool allows you to track essential metrics month by month and cumulatively. Compare your startup’s actual performance against target metrics and visualize your data with customizable, dynamic charts. Whether you’re measuring sales, customer acquisition, or growth metrics, this template offers actionable insights to help your startup scale efficiently. Ideal for founders, startup teams, and entrepreneurs seeking clear, data-driven decision-making tools.
For more details about the template, check the link below;
Customizable and easy to use, you can tailor this dashboard to fit your unique business needs. Save time on reporting and focus on growing your startup by having all the important data clearly organized in a single, easy-to-read dashboard.
This tool is perfect for founders, entrepreneurs, and startup teams looking for an efficient way to monitor their KPIs and make data-driven decisions.
Key Features:
Dynamic and fully editable Excel template
Track essential startup KPIs including revenue, customer acquisition, and expenses
Customizable layout to suit your startup’s specific goals
User-friendly, no advanced Excel skills needed
Perfect for startup founders, business owners, and growth teams
Content:
• Excel file compatible with Excel 2010 and higher (and with sample data)
• Professional Design
• Works both on Mac and Windows
• No installation needed. Ready to use
• Dashboard with charts
• Startup KPI Dashboard
• Easy to use
• 100% editable
• Excel file
• Instant download
• Friendly customer support for all your questions
License: Private Use (not for distribution or resale)
$ 35 -

LNG Economic Model
LNG Distribution Economics Tool
The LNG distribution economics tool presents full economics valuation modelling framework suitable for venture capital and private equity investment analysis. Yes, this is compliant to section 39 on the Nigeria CITA provisions.
Below are the model sections:
Overview and Inputs
-
FISCAL DASHBOARD: Economic results and key performance indicators (KPIs)
-
PROJECT SUMMARY: Summary of key model results and assumptions
-
TERMINAL_INPUTS: Model inputs with yellow background and blue text
-
MODEL DRIVER: Model case development scenario based on “LNG terminal” tab
-
CONTROL: Asset scenario, profit share model, LNG plant capacity profile, production bonus option, and model sensitivity analysis
Fiscal and Financing Analysis
-
FISCALS: Fiscal analysis with assessable taxes and provisional tax holiday models
-
PSC MODEL: Contractor cost recovery, profit split, and entitlement analysis
-
PSC ANALYSIS: Profit share model (R-factor and DROP model)
-
FCFF PREFINANCING: Pre-financing analysis
-
FINANCING: Financing model inputs (annuity approaches, debt modeling with high level charts with executive summaries)
Investment Suitability
-
Suitable for investment consideration across multiple carrying partners
-
I am happy to discuss specifics and opportunities for customizations on interesting opportunities
$ 1,000LNG Economic Model
$ 1,000 -
-

Educational Courses Financial Model
This Excel model forecasts the financial performance of an educational course business over 10 years. It includes detailed course scheduling, revenue projections, expense modeling, 3-statement financial reports, and investor analysis.
$ 75 -

Speech Therapy Center – 5 Year Financial Model
5-Year Speech Therapy Center Financial Model built to support clear financial planning, budgeting, and growth analysis. The model tracks revenue from individual sessions, and group therapy, while detailing costs for staffing, facility operations, supplies, and marketing. Whether starting a new center or improving an existing one, this model provides the financial structure and insights needed for sustainable and efficient operation.
$ 99 -

Employee Training Tracker – Excel Template
With this template, you’ll gain complete visibility into your team’s development progress and resource allocation.
$ 49 -

Recreation & Community Center – 10 Year Financial Model
This 10-Year Financial Model is a detailed financial planning tool designed to project the costs, revenues, and long-term profitability of developing and operating a community-focused facility. The model calculates essential financial metrics including EBITDA, net profit, cash flow, and break-even analysis. With built-in sensitivity analysis and scenario planning, it supports developers, operators, and investors in making informed decisions, securing funding, and ensuring the project’s financial sustainability.
$ 109 -

Private School – 10 Year Financial Model
A 10-Year Financial Model for a startup or existing Private School designed to optimize budgeting, forecasting, and financial planning. This model provides a clear, data-driven framework to manage tuition revenue, operational costs, staff salaries, and capital expenditures. With built-in scenario analysis and key performance indicators, it empowers school administrators to make informed financial decisions, ensuring long-term sustainability and growth.
$ 109