-
OpEX-Workplace Leadership
The provided document, “OpEx – Workplace Leadership” by Vishnu Rayapeddi, focuses on various aspects of effective leadership within an organisational context. It explores different leadership styles, such as autocratic, democratic, laissez-faire, and paternalistic, alongside theories of leadership including trait, behavioural, contingency, transformational, invitational, and transactional approaches. The text also addresses change leadership by outlining how employees react to change and the importance of managing one’s own work through task management strategies like scheduling and prioritisation. Finally, it highlights the significance of engaging a multigenerational workforce by understanding different generations’ values and work styles, and discusses the vital role of communication in fostering effective group and team dynamics
$ 49$ 54OpEX-Workplace Leadership
$ 49$ 54 -
OpRx – Developing a Lean Culture
Develop a Lean Culture
The source, “OpEx – Develop a Lean Culture” by Vishnu Rayapeddi, argues that organisational culture is the most crucial element for business success, not just people. It highlights the high failure rate of Lean implementations, attributing these failures not to the Lean tools themselves, but to an unwillingness to change the underlying culture. The document defines culture, behaviour, and philosophy, and explains that a culture of continuous improvement, led by passionate and accountable leaders, is essential. It further asserts that employee engagement, fostered through meaningful work, development opportunities, and organisational alignment, is the primary driver for successful cultural transformation and achieving desired business outcomes, with Lean tools serving as mere enablers rather than the solution itself.$ 39$ 44OpRx – Developing a Lean Culture
$ 39$ 44 -

P2P Investing Model
This Excel-based P2P investing model allows users to project returns on peer-to-peer lending investments over a 55-year timeframe. It includes features for monthly compounding, cash drag adjustments, deposit/withdrawal tracking, weighted average return calculation, and visual analysis.
$ 75P2P Investing Model
$ 75 -

Pareto Analysis
This Excel-based Pareto Analysis template provides a dynamic tool for identifying and prioritizing key areas of improvement across various business functions. It features automated data ordering, conditional formatting, and visual charts to facilitate clear and actionable insights.
$ 45Pareto Analysis
$ 45 -
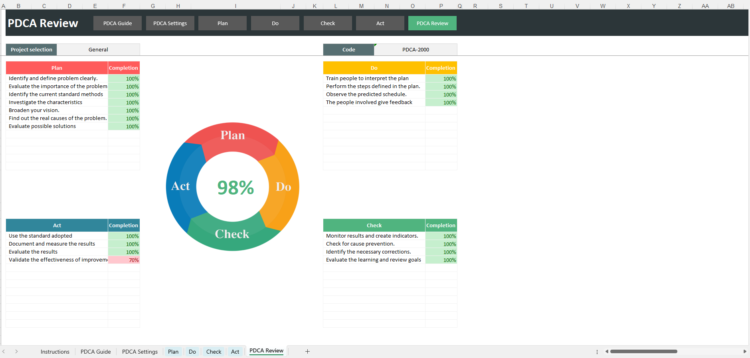
PDCA (Plan–Do–Check–Act) Excel Template
*]:pointer-events-auto scroll-mt-[calc(var(–header-height)+min(200px,max(70px,20svh)))]” tabindex=”-1″ dir=”auto” data-turn-id=”request-WEB:528532bb-fbd0-48c4-84bd-be7f5905ca43-3″ data-testid=”conversation-turn-8″ data-scroll-anchor=”true” data-turn=”assistant”> $ 29 -

Pestle Analysis Template | Excel Template | Business Tool Project Planner | Project Management Analysis Tool
PESTLE Analysis Template
Are you looking for a hassle-free way to analyze your business operations and plan your projects? Look no further than the PESTLE Excel Template from Sirexcelco! Our expertly designed spreadsheet is perfect for businesses of all sizes looking to streamline their project planning and stay ahead of the game.
The PESTLE Excel Template boasts a sleek, modern design with carefully chosen colors to ensure a pleasant user experience. Our easy-to-use interface allows users to input their issues with ease, while the automatic task numbering system takes the stress out of keeping track of your progress.
Content:
• Excel file compatible with Excel 2007 and higher (and with sample data)
• Professional Design
• Works both on Mac and Windows
• No installation needed. Ready to use
• Pestle Analysis Template
• Easy to use
• 100% editable
• Excel file
• Instant download
• Friendly customer support for all your questions
License: Private Use (not for distribution or resale)
$ 5 -
Prince2 & Agile Excel RAID log template, track project Risks, Assumptions, Issues, Dependencies (plus other key logs)
Prince2 & Agile Excel RAID log template to track Risks, Assumptions, Issues, Dependencies & more. Editable, comprehensive & ideal for project managers.
$ 30$ 40 -
Prince2 & Agile Weekly / Monthly Project Status Report for Client / Internal reporting of Project Health, 3 formats
Prince2 & Agile project status report template in 3 PPT formats. Ideal for client & internal reporting of project health, risks, milestones & progress.
$ 30$ 40 -
PRINCE2 7th Edition Planner MS Templates Download – Both Microsoft Project MPP msp & ms Excel and Word Formats – Prince2
PRINCE2 7th Edition MS Templates Download – Microsoft Project MPP msp ms Excel and Word Formats – Prince2 Template Toolkit
$ 40$ 50 -
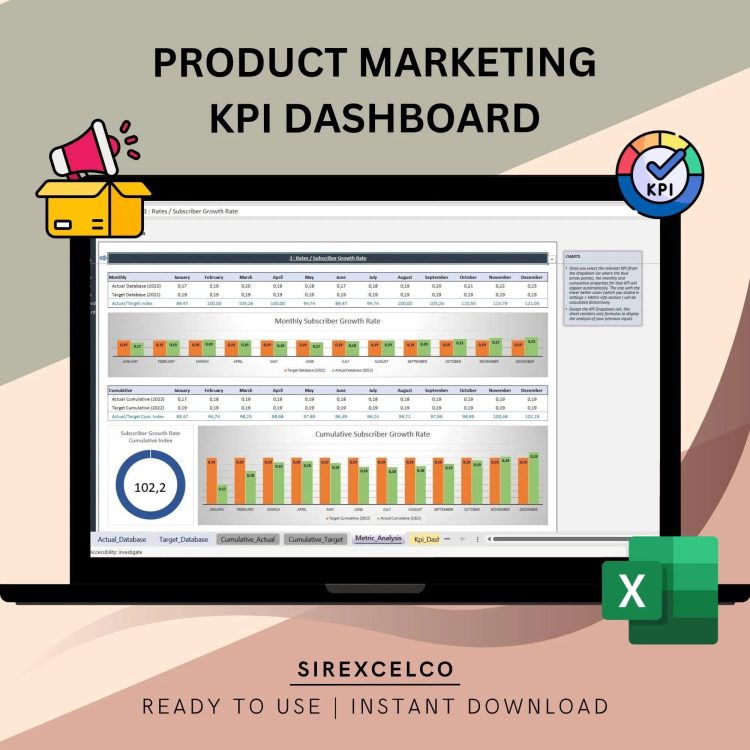
Product Marketing KPI Dashboard Excel Template | Dynamic Product Performance Tracker | Monthly & Cumulative Marketing KPI Analysis
Simplify your product marketing performance tracking with our Product Marketing KPI Dashboard Excel Template.
For more details about the template, check the link below;
This user-friendly Excel template allows marketers, product managers, and business owners to measure and compare key product marketing metrics month by month and cumulatively. Whether you need to track sales, customer acquisition, or campaign performance, this tool dynamically updates with interactive charts, letting you instantly compare target vs. actual metrics. Perfect for anyone looking to make data-driven decisions and improve marketing strategies, this template is designed for ease of use while providing deep insights into product performance.
What this means is that finding the right product marketing metrics is extremely crucial. Among the sea of options available, it’s important to identify which metrics are key to the success of your business. Otherwise, it’s easy to miss the wood for the trees and start tracking too much or too little.
Best for:
• Marketing Experts
• Product Marketers
• Everyone starting with a new project
Content:
• Excel file compatible with Excel 2010 and higher (and with sample data)
• Professional Design
• Works both on Mac and Windows
• No installation needed. Ready to use
• Dashboard with charts
• Product Management KPI Dashboard Template
• Easy to use
• 100% editable
• Excel file
• Instant download
• Friendly customer support for all your questions
License: Private Use (not for distribution or resale)
$ 35 -

Professional Services Financial Model
The fully upgraded Professional Services or Agency Financial Model is a comprehensive tool designed for businesses’ billing time. It includes projections for five years, covering income statements, balance sheets, cash flow statements, CapEx, and an upgraded cap table. Fully customizable, it supports scenario planning, revenue forecasts, professional types, fixed and variable costs, and investor equity calculations. Ideal for agencies and firms like law or CPA practices, this model is perfect for financial planning and scaling.
$ 75