Harnessing Technology: The Key to Future-Proofing Your Business
Technology is everywhere. It’s not just the gadgets we use but the systems and processes that simplify our lives and change how we interact with the world. Whether it’s AI-powered neural networks or 3D printing in the medical field, technology is evolving rapidly and reshaping industries.
Everyday Applications of Technology
Smartphones and Wireless Networks
We rely on technology daily, from our smartphones to the wireless computer networks that keep us connected. Think about how you communicate with friends or run your business—technology is the silent partner making it happen. These wireless systems create a dynamic network, allowing access to information and real-time communication from anywhere.
Healthcare and Innovation
In the medical field, technology is transforming how future generations of doctors are trained. For example, 3D-printed mannequin hands are giving medical students hands-on practice before they step into real-life situations. It’s not just about convenience—technology is offering experiential opportunities that were hard to imagine just a few years ago.
Artificial Intelligence and Neural Networks
Neural networks are the backbone of artificial intelligence, helping machines process data in ways that feel almost human. From predicting trends on Wall Street to aiding law enforcement, AI is taking on tasks that once required human intelligence. These systems are evolving, becoming more intuitive, and playing a critical role in many industries.
AI isn’t just for big companies. Think about the voice assistants in your home or the algorithms helping you shop online. They all use AI to improve the customer experience, making technology feel more personal and engaging.
The Future of Technology
As we continue to push boundaries, future generations will have access to tools and opportunities that didn’t exist before. From Apple Intelligence systems to dynamic networks in education, the world of technology is expanding and becoming a key part of everyday life, reshaping how we work, learn, and live.
In the end, technology is about making life easier, smarter, and more connected. Whether in healthcare, education, or communication, it’s the driving force behind innovation. What’s exciting is that we’re just scratching the surface of what’s possible.
How Technology is Improving Business Operations?
Technology is revolutionizing how businesses operate, making processes smoother, faster, and smarter. Businesses are rapidly embracing technology, from artificial intelligence to wireless networks, to stay competitive and keep up with the fast-changing market demands.
AI and Neural Networks
Artificial intelligence (AI) is at the forefront of business innovation. Neural networks, a form of AI that mimics human intelligence, are helping companies analyze massive amounts of data, predict trends, and improve decision-making processes. Whether it’s in San Francisco tech hubs or startups around the world, AI is playing a major role in shaping the future of business operations.
AI for Law Enforcement and Security
AI is also being used by businesses in law enforcement and security industries, offering solutions that enhance safety and efficiency. From facial recognition to pattern analysis, AI applications are helping companies and governments protect assets and improve response times.
Enhancing Networks and Communication
Wireless computer networks are becoming more sophisticated, allowing businesses to create dynamic networks that enable real-time communication. This is essential for industries where rapid responses and data exchange are key, such as financial services or logistics. By leveraging these networks, businesses can remain agile and responsive to market changes.
Some businesses are adopting a top-down approach, using advanced tech solutions from leading companies like Apple Intelligence, while others favor a bottom-up approach, relying on employee-driven innovations. Both strategies are effective in creating an environment where technology drives growth.
Enhancing Networks and Communication
In fields such as healthcare and education, technology is preparing future generations through experiential opportunities. Medical schools are using 3D-printed mannequin hands for surgical practice, giving students hands-on experience before they step into real-world scenarios. Graduate school programs are incorporating technology into curriculums, ensuring students are ready for tech-driven industries.
Advanced Degrees and Industry-Aligned Training
Businesses are also focusing on advanced degree programs and industry-aligned training that equips employees with the knowledge needed to thrive in a tech-centric world. This approach ensures that both current and future workers have access to opportunities for continuous learning and skill development.
Tech-Driven Innovation for the Future
Companies like Apple and innovators are pushing the boundaries of what technology can achieve in business. Their innovations in AI and human intelligence are paving the way for future business models that are more efficient and customer-focused.
The Future is Here
From improving everyday knowledge applications to offering businesses the tools they need to remain competitive, Technology has become a core element of every successful business strategy. Whether through AI, dynamic networks, or advanced degrees, companies are finding that technology provides them with a competitive edge, ensuring constant improvement and long-term growth.
How Can OfficeDocDepot Enhance Your Technological Solutions?
At OfficeDocDepot, we recognize the evolving demands of businesses in today’s tech-driven world. From AI-powered automation to data-driven decision-making, our platform offers an array of resources designed to enhance your technological solutions. Whether you’re looking to harness the power of machine learning or secure your business with cutting-edge cybersecurity strategies, we provide the tools you need to stay ahead.
OfficeDocDepot serves as a bridge, connecting you with comprehensive solutions that cater to your specific needs. We make it easy to adopt advanced technologies like AI, blockchain, and data analytics, ensuring that you can integrate these into your operations seamlessly. This saves you valuable time and helps future-proof your business by staying aligned with the latest advancements.
Our platform helps you navigate digital transformation, offering everything from smart contracts to threat detection systems. By leveraging these resources, you can ensure that your business remains competitive, secure, and primed for growth in an increasingly tech-centric landscape.
Visit OfficeDocDepot today to discover how our expertly curated resources can elevate your technological strategies and streamline your operations with confidence.
Frequently Asked Questions
How is technology changing the way businesses operate?
Technology is streamlining business operations by automating tasks, improving communication, and enhancing decision-making through tools like AI and data analytics. It allows businesses to be more efficient, respond faster to market changes, and optimize their workflow.
What role does artificial intelligence (AI) play in business today?
AI helps businesses analyze vast amounts of data, automate routine tasks, predict trends, and provide personalized customer experiences. AI-powered tools, such as neural networks, are being used in industries ranging from finance to healthcare, improving both efficiency and accuracy.
How can wireless networks improve business operations?
Wireless networks enable seamless communication and data transfer within a business. They support real-time collaboration, remote work, and the integration of smart devices, which helps companies stay agile and responsive.
How can businesses use technology to enhance customer service?
Technology enhances customer service through AI chatbots, customer relationship management (CRM) systems, and real-time communication tools. These technologies help businesses provide faster, personalized support and improve overall customer satisfaction.
What are the benefits of implementing tech-driven strategies in business?
Tech-driven strategies help businesses reduce operational costs, increase productivity, and stay competitive. Technology also enables companies to make data-driven decisions, streamline processes, and create new revenue streams.
How does technology impact employee performance and training?
Technology improves employee performance by automating repetitive tasks and providing tools for better collaboration. It also enhances training through online learning platforms, AI-driven assessments, and virtual simulations, allowing employees to develop skills more effectively.
Conclusion
In today’s fast-paced world, technology is no longer just an option for businesses—it’s a necessity. From improving operational efficiency to enhancing customer service and decision-making, technology plays a critical role in driving success. Whether through artificial intelligence, data analytics, or wireless networks, businesses that leverage the right tools can stay competitive, boost productivity, and foster growth. By staying updated with industry trends and continuously evolving, companies can ensure they remain agile and prepared for the future. Embracing technology is key to thriving in the modern business landscape.
-
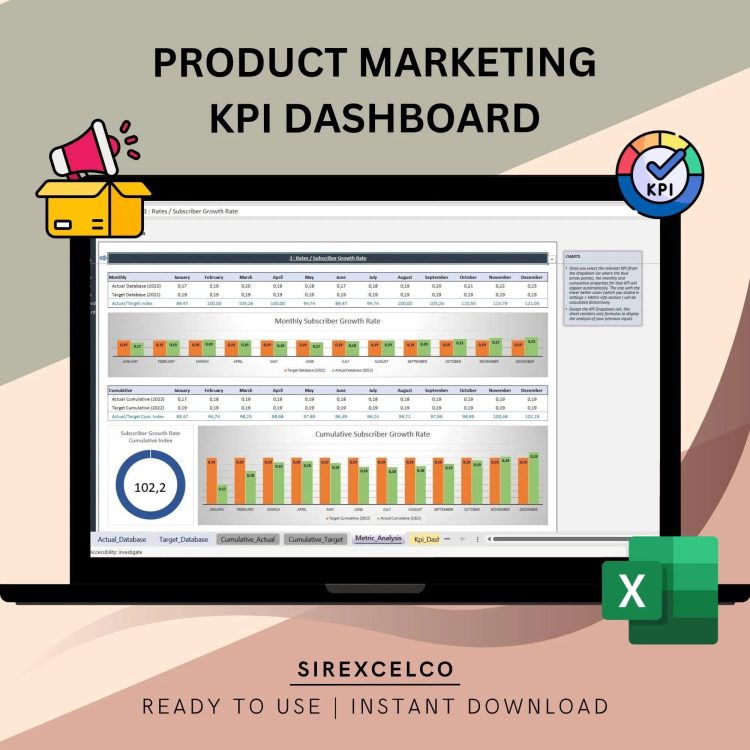
Product Marketing KPI Dashboard Excel Template | Dynamic Product Performance Tracker | Monthly & Cumulative Marketing KPI Analysis
Simplify your product marketing performance tracking with our Product Marketing KPI Dashboard Excel Template.
For more details about the template, check the link below;
This user-friendly Excel template allows marketers, product managers, and business owners to measure and compare key product marketing metrics month by month and cumulatively. Whether you need to track sales, customer acquisition, or campaign performance, this tool dynamically updates with interactive charts, letting you instantly compare target vs. actual metrics. Perfect for anyone looking to make data-driven decisions and improve marketing strategies, this template is designed for ease of use while providing deep insights into product performance.
What this means is that finding the right product marketing metrics is extremely crucial. Among the sea of options available, it’s important to identify which metrics are key to the success of your business. Otherwise, it’s easy to miss the wood for the trees and start tracking too much or too little.
Best for:
• Marketing Experts
• Product Marketers
• Everyone starting with a new project
Content:
• Excel file compatible with Excel 2010 and higher (and with sample data)
• Professional Design
• Works both on Mac and Windows
• No installation needed. Ready to use
• Dashboard with charts
• Product Management KPI Dashboard Template
• Easy to use
• 100% editable
• Excel file
• Instant download
• Friendly customer support for all your questions
License: Private Use (not for distribution or resale)
$ 35 -
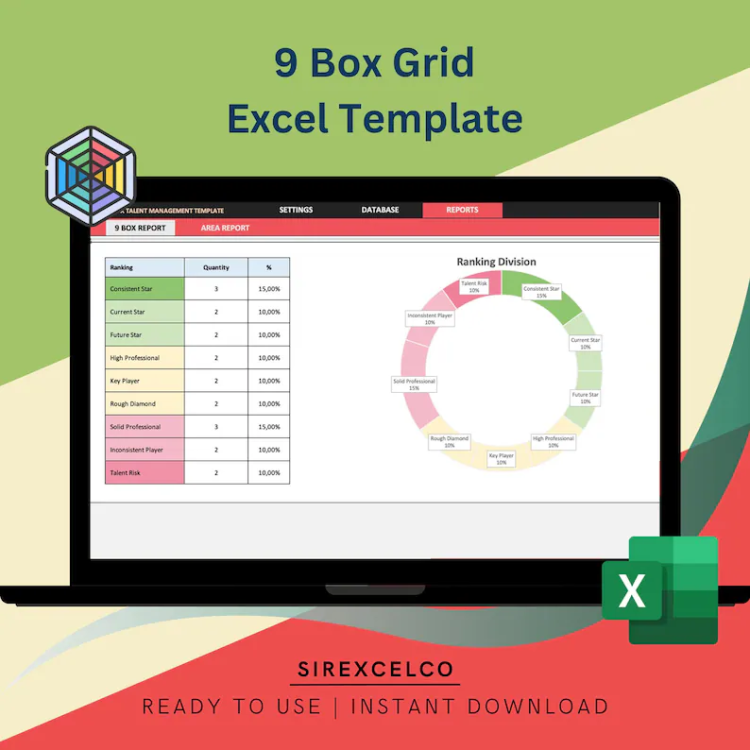
9 Box Grid Dashboard Excel Template | Employee Performance Potential Ranking | Talent Management | HR Assessment | Easy to Use
Enhance your talent management strategy with this 9-Box Grid Dashboard Excel Template.
For more details about the template, check the link below;
This tool enables managers and HR professionals to rank employees based on potential and performance, visualizing data with a 9-box grid framework. Ideal for tracking growth opportunities, assessing team dynamics, and developing succession plans. Simply input your data into an easy-to-use database, and the dynamic charts will display performance insights, making it an indispensable resource for employee evaluation and department analysis. A powerful and user-friendly tool for strategic workforce planning!
The 9-box grid is most commonly used in succession planning as a method of evaluating an organization’s current talent and identifying potential leaders. When leadership performance and potential are assessed and plotted on the graph, individuals in the upper right quadrant (Box 1) are identified as high-potential candidates for succession, while those in the lower left quadrant (Box 9) may need to be reassigned or removed from the organization.
The boxes on the grid indicate where investment needs to be made to develop future leaders. Those people in box 1 should be ready for top leadership within 6 months to a year; those in boxes 2, 3, or 6 have a longer timeline but can be groomed for eventual movement to box 1.
A useful tool for analyzing and visualizing data is the 9 Box Grid. You can quickly and simply create beautiful, interactive dashboards that bring your data to life using this template.
This template is perfect for managers, business owners, and data analysts who need to use their data to make decisions. It’s the ideal solution for anyone who wants to advance their data analysis because to its user-friendly interface and robust functionality.
Get hold of the 9 Box Grid Dashboard Excel Template right away to start utilizing your data to its full potential!
Best for:
• Talent Professionals
• HR Professionals
• All types of companies
Content:
• Excel file compatible with Excel 2007 and higher (and with sample data)
• Professional Design
• Works both on Mac and Windows
• No installation needed. Ready to use
• Dashboard with charts
• 9 Box Grid Assessment Dashboard Template
• Easy to use
• 100% editable
• Excel file
• Instant download
• Friendly customer support for all your questions
License: Private Use (not for distribution or resale)
$ 11 -
CRM KPI Report Dashboard Excel Template | Dynamic Charts & Metrics | Track Monthly and Cumulative Performance
Take control of your CRM performance with this CRM KPI Report Dashboard Excel Template!
For more details about the template, check the link below;
Whether you’re looking to measure sales, customer engagement, or other key CRM metrics, this template helps you track performance month by month and cumulatively. With a simple input of data, you can compare target vs actual metrics and see the results in dynamic charts that update based on the metric you select.
This Excel template is designed for businesses, marketers, and data analysts who want to stay organized and make data-driven decisions. Easy to use and fully customizable, it requires no advanced Excel knowledge. Simply enter your CRM data, select the metric you want to analyze, and let the template do the rest!
Key Features:
Compare actual CRM performance vs target metrics
Track key CRM metrics on a monthly and cumulative basis
Dynamic charts that update based on selected metrics
User-friendly, no advanced Excel skills required
Perfect for tracking sales, customer interactions, and engagement
Fully customizable to suit your specific needs
This tool is ideal for those looking to improve CRM processes and make informed business decisions with ease.
Content:
• Excel file compatible with Excel 2010 and higher (and with sample data)
• Professional Design
• Works both on Mac and Windows
• No installation needed. Ready to use
• Dashboard with charts
• CRM KPI Dashboard Template
• Easy to use
• 100% editable
• Excel file
• Instant download
• Friendly customer support for all your questions
License: Private Use (not for distribution or resale)
$ 35 -
Editable Invoice Excel Template | Printable Business Invoice | Small Business Invoice form | With Contact Database | Photography Invoice
Utilize our Editable Invoice Excel Template to streamline your billing procedure!
For more details about the template, check the link below;
By automating the invoicing process and offering a complete database to hold all your client information, this robust template is made to simplify your life. You can quickly and easily create expert invoices that appropriately represent your business thanks to its user-friendly design.
You can customize the template’s many editable fields to make your invoice design speak to your unique requirements. All of your client data is conveniently and securely stored in the built-in customer database, making it accessible anytime you need it.
This template is the ideal tool to help you manage your invoicing process, whether you’re a small business owner, freelancer, or consultant.
Get hold of the Excel invoice template right away to get the most out of your billing procedure and create a Professional Invoice.
Content:
• Excel file compatible with Excel 2007 and higher (and with sample data)
• Professional Design
• Works both on Mac and Windows
• No installation needed. Ready to use
• Invoice Excel Template
• Easy to use
• 100% editable
• Excel file
• Instant download
• Friendly customer support for all your questions
License: Private Use (not for distribution or resale)
Thanks for visiting!
$ 6 -
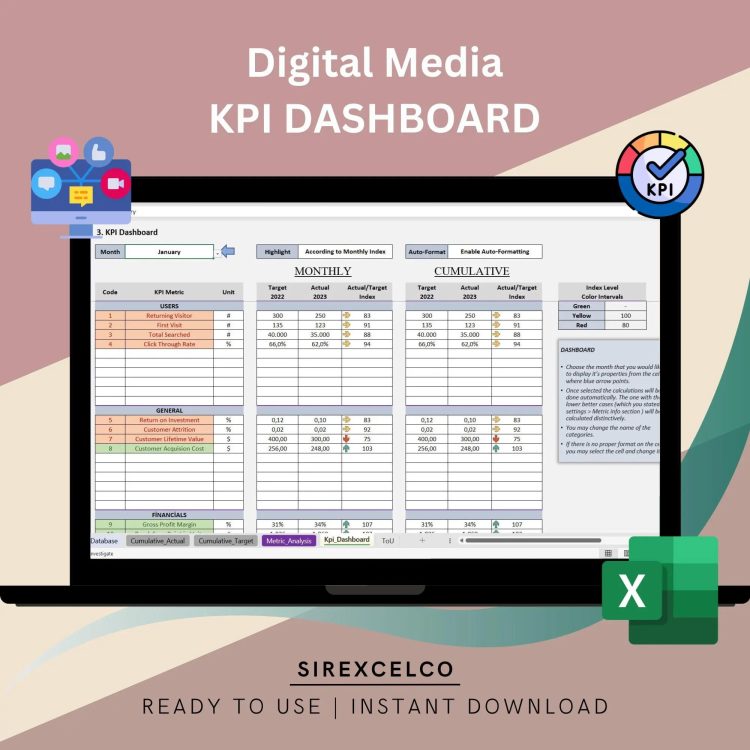
Digital Media KPI Report Excel Template | Track Monthly & Cumulative Metrics | Dynamic Charts and Performance Analysis
Track and optimize your digital media performance with this Digital Media KPI Report Excel Template!
For more details about the template, check the link below;
Whether you’re monitoring ad performance, engagement metrics, or overall digital media strategy, this template provides a clear, comprehensive view of your results. Compare your target metrics against actual performance, track progress month by month and cumulatively, and visualize your data with dynamic charts that automatically update based on your selected metric.
Ideal for digital marketers, content creators, and media managers, this template is incredibly easy to use—just enter your data, and the template takes care of the rest. No advanced Excel skills are needed, making it perfect for professionals looking to improve their digital media strategy with reliable, visual data analysis.
Key Features:
-Track digital media metrics on a monthly and cumulative basis
-Compare target vs actual performance
-Dynamic charts that adjust based on selected metrics
-Fully customizable and user-friendly
-Perfect for digital marketers, ad specialists, and content managers
-Requires no advanced Excel knowledge
-This template is an essential tool for anyone who wants to streamline their digital media performance tracking and make data-driven decisions with ease.
Material:
📝 Spreadsheet
🖥️ Microsoft Excel
📇 Excel Spreadsheet
📄 Excel Sheet
📑 Printable
🚦 Decision Making Tool
🔧 Decision Maker
🗂️ Organizing Tool
🌐 Google Sheets
⬇️ Digital Download
🎉 Easy to use
🎈 Ready to use
💹 KPI
Best for:
• Publishers
• Bloggers
• Everyone starting with a new project
Content:
• Excel file compatible with Excel 2010 and higher (and with sample data)
• Professional Design
• Works both on Mac and Windows
• No installation needed. Ready to use
• Dashboard with charts
• Digital Media KPI Dashboard Template
• Easy to use
• 100% editable
• Excel file
• Instant download
• Friendly customer support for all your questions
License: Private Use (not for distribution or resale)
$ 35 -
Comprehensive SWOT Analysis Excel Template | Strategic Task Categorization & Business Planning Tool, Opportunities Template
Easily evaluate and organize your business tasks with this Comprehensive SWOT Analysis Excel Template.
Designed to provide a structured format for identifying Strengths, Weaknesses, Opportunities, and Threats, this template simplifies the process of strategic analysis. Perfect for entrepreneurs, business managers, and project planners, it allows users to enter information directly into an organized database, generating insightful visualizations for decision-making. Whether you’re aiming to improve internal processes, explore market opportunities, or tackle potential risks, this easy-to-use template offers a practical solution for effective planning and analysis.
With our user-friendly and visually appealing spreadsheet, conducting a SWOT analysis has never been easier. The template features a well-designed layout with carefully chosen colors that enhance clarity and focus. You can effortlessly enter your business issues and watch as the task numbers are automatically generated, making organization a breeze.
Whether you’re a seasoned entrepreneur or just starting out, our SWOT Analysis Excel Template is an invaluable tool for strategic planning and business growth. Gain valuable insights into your strengths, weaknesses, opportunities, and threats, and use this information to chart your path to success.
Don’t let decision-making be a daunting task. Empower yourself with the SWOT Analysis Excel Template from Sirexcelco and unlock the full potential of your business. Get started today and embrace the power of informed choices!
Content:
• Excel file compatible with Excel 2007 and higher (and with sample data)
• Professional Design
• Works both on Mac and Windows
• No installation needed. Ready to use
• Swot Analysis Template
• Easy to use
• 100% editable
• Excel file
• Instant download
• Friendly customer support for all your questions
License: Private Use (not for distribution or resale)
$ 3 -
Social Media KPI Dashboard Excel Template | Track Social Media Metrics | Monthly & Cumulative Analysis | Dynamic Social Media Reports
Easily track and analyze your social media performance with this Social Media KPI Dashboard Excel Template.
For more details about the template, check the link below;
Ideal for marketers, influencers, and social media managers, this template helps you monitor your monthly and cumulative social media KPIs. Compare actual performance against target metrics, visualize data through dynamic charts, and gain insights to optimize your social media strategies. Whether you’re measuring engagement, growth, or content performance, this template makes managing your social media metrics simple and efficient.
Designed for marketers, influencers, and business owners, this template is incredibly user-friendly and requires no advanced Excel skills. Simply input your data, choose the metric you want to focus on, and the template will automatically generate charts to help you monitor your success.
Key Features:
Track social media metrics monthly and cumulatively
Compare target metrics vs actual performance
Dynamic charts that update based on selected metrics
User-friendly and fully customizable
Perfect for marketers, influencers, and social media managers
No advanced Excel knowledge needed
This template is an essential tool for anyone looking to improve their social media strategy and measure performance with accuracy.
Best for:
• Socal Media Experts
• Bloggers
• Everyone starting with a new project
• Marketing Experts
• Influencers
• Everyone opening a business
This tool will help you analyze your Monthly Kpi Metric data.
After you insert your Monthly Numeric data for the KPI Metrics you determine, you can see a clear monthly and cumulative analysis for the metrics you determine. It is also possible to compare your numeric data with your target data and past year data.
Seeing the level of difference of these metrics will help you identify the problem and how to improve your model more effectively and efficiently.
Content:
• Excel file compatible with Excel 2010 and higher (and with sample data)
• Professional Design
• Works both on Mac and Windows
• No installation needed. Ready to use
• Dashboard with charts
• Social Media KPI Dashboard Template
• Easy to use
• 100% editable
• Excel file
• Instant download
• Friendly customer support for all your questions
License: Private Use (not for distribution or resale)
Thanks for visiting!
$ 35 -
Marketing KPI Report Excel Template | Track Monthly & Cumulative Metrics | Dynamic Charts and Performance Analysis
Take control of your marketing performance with this Marketing KPI Report Excel Template!
For more details about the template, check the link below;
Whether you’re monitoring campaign success, lead generation, or engagement metrics, this template offers a powerful way to track your marketing metrics month by month and cumulatively. You can easily compare target vs actual results and visualize your progress through dynamic charts that automatically update based on the metric you select.
Perfect for marketers, business owners, and marketing professionals, this template requires no advanced Excel skills and is fully customizable to meet your needs. Simply input your data and watch the template do the heavy lifting, helping you make informed, data-driven decisions to improve your marketing efforts.
Key Features:
Track marketing metrics on a monthly and cumulative basis
Compare target vs actual performance
Dynamic charts that update with chosen metrics
User-friendly and easy to customize
Ideal for marketers, business owners, and marketing teams
No advanced Excel skills required
This template is an essential tool for anyone looking to streamline their marketing reporting and make data-backed decisions.
Content:
• Excel file compatible with Excel 2010 and higher (and with sample data)
• Professional Design
• Works both on Mac and Windows
• No installation needed. Ready to use
• Dashboard with charts
• Marketing Kpi Dashboard Excel Template
• Easy to use
• 100% editable
• Excel file
• Instant download
• Friendly customer support for all your questions
License: Private Use (not for distribution or resale)
$ 35 -
Project Management KPI Report Excel Template | Track Monthly and Cumulative Metrics | Dynamic Charts & Performance Analysis
Take control of your projects with the Project Management KPI Report Excel Template!
For more details about the template, check the link below;
This template makes it easy to monitor your project performance by tracking key metrics month by month and cumulatively. Whether you need to compare target metrics with actual results or visualize progress through dynamic charts, this tool simplifies the process for project managers, team leaders, and business professionals.
No advanced Excel skills are needed to use this fully customizable template. Simply input your project data, choose the metric you want to focus on, and the template will automatically generate reports and charts to keep your projects on track.
Key Features:
Track project management KPIs monthly and cumulatively
Compare target vs actual performance metrics
Dynamic charts that update automatically based on the selected metrics
User-friendly and fully customizable to your project needs
Ideal for project managers, team leads, and business professionals
No advanced Excel knowledge required
This template helps you make data-driven decisions and ensures that your projects are completed efficiently and on time.
Content:
• Excel file compatible with Excel 2010 and higher (and with sample data)
• Professional Design
• Works both on Mac and Windows
• No installation needed. Ready to use
• Dashboard with charts
• Project Management KPI Dashboard Template
• Easy to use
• 100% editable
• Excel file
• Instant download
• Friendly customer support for all your questions
License: Private Use (not for distribution or resale)
$ 35 -
Healthcare KPI Dashboard Excel Template, KPI Report, Dynamic Reporting File, Performance Tracking Report
Healthcare KPI Dashboard
Introducing our “Healthcare KPI Dashboard & Excel KPI Report Template”, the ultimate tool crafted for healthcare professionals seeking effortless dynamic reporting and performance tracking. This innovative tool is not just your average ‘dashboard decor’; it’s a vital assistant that turns your daily data into a seamless dashboard planner.
For more details about the template, check the link below;
📊 SPREADSHEET: A meticulously designed Excel spreadsheet, perfect for crunching numbers, visualizing data, and generating insightful reports.
💼 MICROSOFT EXCEL: Built explicitly for the platform you know and trust. Harness the power of Excel and simplify your complex data interpretation.
🎯 EXCEL SPREADSHEET: A health-specific KPI Excel template with a focus on metrics crucial for performance measurement.
🗂 EXCEL SHEET: Simplify your data organization. Use our Excel sheet as your ride-or-die for data management, be it for patient health tracking, personnel management, or financial planning.
🖨 PRINTABLE: Want to share your findings out of the digital world? Our product comes with easy-to-print options.
🔑 DECISION MAKING TOOL: Transform complex data into actionable insights. Our dashboard helps you make informed decisions, fast and efficient.
👑 DECISION MAKER: This tool gives you the power to make the tough decisions via its intelligent design and high usability.
🧹 ORGANIZING TOOL: Say goodbye to cluttered information and hello to organized, easy-to-understand data.
🌐 GOOGLE SHEETS: For Google lovers, the dashboard is entirely compatible, bringing the same efficiency and clarity.
📂 DIGITAL DOWNLOAD: Instant access post-purchase, no waiting, no shipping fees. Get started right away!
🎯 EASY TO USE: We’ve designed this with you in mind. Its user-friendly interface makes it a breeze to use, even for the non-tech savvy.
📁 XLSX: Offering seamless compatibility with your favourite software, be it MS Excel, Google Sheets or other compatible programs.
Experience the ease and efficiency of our Healthcare KPI Dashboard today. Collect, analyze, and achieve all in one go! Thank you for stopping by. Looking forward to elevating your reporting process with our dashboard.
Please don’t hesitate to reach out if you have any questions, we are always here to help! Enjoy shopping and have a fantastic day!
As healthcare professionals, we understand the importance of data-driven decision-making in providing the best patient care and optimizing healthcare operations. Our Healthcare KPI Dashboard Excel template is designed to empower healthcare practitioners, administrators, and analysts with the tools they need to track and analyze key performance indicators effectively.
Why choose our Healthcare KPI Dashboard?
Streamlined Data Analysis: Our template provides a user-friendly interface that simplifies the process of collecting and analyzing crucial healthcare metrics. No more sifting through stacks of papers or struggling with complex spreadsheets. Our dashboard consolidates all the essential KPIs in one place, allowing you to focus on what matters most – improving patient outcomes.
Comprehensive Metrics: Our template covers a wide range of healthcare KPIs, ensuring you have a holistic view of your organization’s performance. From patient satisfaction and readmission rates to average length of stay and revenue per procedure, our dashboard provides insights into every aspect of your healthcare operations.
Customizable and Easy to Use: We understand that every healthcare organization is unique, and that’s why our template is fully customizable. Tailor it to your specific needs by adding or removing KPIs, adjusting timeframes, and customizing visualizations. Even if you’re not an Excel expert, our intuitive design makes it easy to navigate and update your data effortlessly.
Time and Cost Savings: By automating data collection and analysis, our Healthcare KPI Dashboard saves you valuable time and resources. Say goodbye to manual data entry and complex calculations. With just a few clicks, you’ll have real-time insights into your healthcare performance, allowing you to make informed decisions quickly.
Who can benefit from our Healthcare KPI Dashboard?
• Healthcare administrators: Track key metrics to optimize resource allocation, improve efficiency, and enhance patient experience.
• Hospital managers: Monitor patient flow, readmission rates, and revenue per procedure to identify areas for improvement.
• Medical practitioners: Analyze patient satisfaction and clinical outcomes to enhance the quality of care provided.
• Healthcare analysts: Extract actionable insights from data trends and identify opportunities for operational enhancements.
Content:
• Excel file compatible with Excel 2010 and higher (and with sample data)
• Professional Design
• Works both on Mac and Windows
• No installation needed. Ready to use
• Dashboard with charts
• Healthcare KPI Dashboard Template
• Easy to use
• 100% editable
• Excel file
• Instant download
• Friendly customer support for all your questions
License: Private Use (not for distribution or resale)
$ 35 -
Instagram Profile Tracker Excel Template | Who Unfollowed You on Instagram, See Who BAE Followed | No Login Required, No Code in Browser
Instagram Follower Tracker
Introducing our unique Instagram Follower Tracker, a brilliant tool created with an intuitive Excel Template format. 😊 It’s as practical as it is highly effective, making it a must-have if you’re serious about mastering your Instagram game. 💻📈
For more details about the template, check the link below;
Stay updated on changes to your Instagram profile with this dynamic Instagram Profile Tracker Excel Template. Perfect for those who want to keep a close eye on follower activity without needing to log in or share account information. This template tracks new adds and discards between two dates, identifies accounts you follow that don’t follow back, and shows accounts that follow you but you don’t follow back. With one click, you can easily access these profiles online. It’s user-friendly, secure, and a must-have tool for those invested in managing their Instagram relationships with ease.
🔎 Check Your Followers – Ever felt lost in the sea of Instagram followers? Our tracker provides a simple, easy-to-use interface that lets you keep tabs on your followers. You’ll have a detailed following and follower report at your fingertips, offering a much-needed overview of your Instagram engagement. 🏷️
🔧 Who is Following Instagram – This isn’t just an Excel Template; it’s an eye-opener, revealing who is following your Instagram. Stay informed, strategize, and grow your IG community like never before! 📊
🕵️♂️ Who Has Unfollowed – Discover who has unfollowed you on Instagram. This tracking tool makes the hard truth easy to digest, giving you the intel you need to refine your content strategy. 🔄
📝 Excel Template – Made with utmost precision and attention to functionality, this solution is designed to be easy-to-use. Even if you’ve never used an Excel Template before, you’ll find its layout and design to be a breeze. 🎯
✨ Unique Features – This Instagram Follower Tracker is filled with unique, user-friendly features, specifically designed to give you optimal control in managing your Instagram followers. From a sleek design to a comprehensive, easy-to-read format, this tool ticks all the right boxes. 🔑
Thank you so much for checking out my shop! Please don’t hesitate to message me with any questions or customization inquiries. I appreciate your business and look forward to assisting you with your Instagram Follower Tracker needs. Brighten up your Instagram experience today with our truly exceptional tool. 🌟
+ Creating a well-curated Instagram audience couldn’t be easier! 🎉
Can’t wait to see you succeed, and happy tracking! 🌈👍🦋
Content:
• Excel file compatible with Excel 2010 and higher (and with sample data)
• Professional Design
• Works both on Mac and Windows
• No installation needed. Ready to use
• Instagram Follower Tracker Excel Template
• Easy to use
• 100% editable
• Excel file
• Instant download
• Friendly customer support for all your questions
License: Private Use (not for distribution or resale)
$ 20 -
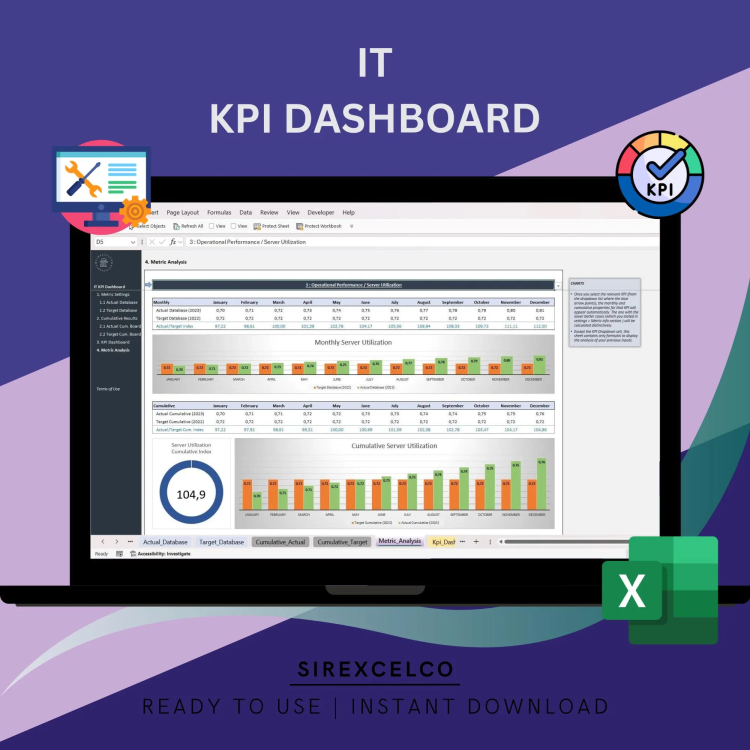
Database-Driven KPI Dashboard Excel Template | Monthly YoY Analysis | Metric Analysis by Entering Data in a Database | Performance Report
Database-Driven KPI Dashboard
Streamline your KPI tracking with this Database-Driven KPI Dashboard Excel Template. Unlike standard templates, this tool allows you to enter data into a database, automatically calculating values and ratios for monthly and cumulative performance tracking. Easily compare your metrics against targets or analyze year-over-year (YoY) performance with dynamic charts and visualizations. Perfect for business professionals and owners looking for an intuitive way to track and compare key metrics. This template simplifies data entry, aggregates results, and provides actionable insights, making it a must-have for performance analysis.
For more details about the template, check the link below;
Content:
• Excel file compatible with Excel 2010 and higher (and with sample data)
• Professional Design
• Works both on Mac and Windows
• No installation needed. Ready to use
• Dashboard with charts
• Database-Driven KPI Dashboard Excel Template
• Easy to use
• 100% editable
• Excel file
• Instant download
• Friendly customer support for all your questions
License: Private Use (not for distribution or resale)
$ 40