-
Project POAP – MS PowerPoint template – Both editable & easy to use
Microsoft PowerPoint template both editable & easy to use, offers a quick way to construct a PPT Project Plan On a Page ( POaP ) for stakeholders
$ 30$ 40 -
OpEx – Poka-Yoke (Mistake Proofing)
Poka-Yoke: The Art of Mistake Proofing
The source, titled “OpEx – Poka Yoke Mistake proofing.pdf,” outlines a comprehensive approach to achieving operational excellence through mistake-proofing, also known as Poka-Yoke. It emphasises that defects account for a significant portion of production costs and stresses the importance of preventing errors at the source rather than merely inspecting them out. The document introduces principles for achieving zero defects, focusing on process control over individual blame, and explores various categories of error and their prevention strategies. It details six mistake-proofing techniques—elimination, replacement, prevention, facilitation, detection, and mitigation—providing examples for each. Finally, it presents a seven-step framework for implementing error-proofing and a five-part project methodology for designing defects out of processes, encouraging continuous improvement and team invol$ 34$ 39OpEx – Poka-Yoke (Mistake Proofing)
$ 34$ 39 -
OpEx – JIT Heijunka, Load Levelling
Heijunka: Production Leveling This document
from OpExNZL, authored by Vishnu Rayapeddi, provides a comprehensive overview
of Heijunka, or production levelling, as a gateway to operational excellence.
It outlines prerequisites for implementing Heijunka, including 5S, Standard
Work, and SMED (Quick Changeovers). The core concepts of Just-In-Time (JIT)
manufacturing are thoroughly explained, encompassing Takt Time, Continuous
Flow, and Pull Systems. The document details the benefits, applications, and
success factors for each of these JIT principles, offering practical examples
and visual aids like cellular manufacturing layouts and Kanban systems.
Finally, it focuses on Production Levelling, contrasting it with batch
manufacturing, demonstrating its benefits in managing customer demand and variations,
and outlining steps for its incorporation, such as calculating Takt Time and
Pitch and using a Leveling Box.$ 34$ 39OpEx – JIT Heijunka, Load Levelling
$ 34$ 39 -

Risk Management KPI Dashboard Excel Template, Excel Risk Metrics Report Template Digital File, Risk Assessment Dynamic Reporting Tracker
Risk Management KPI Dashboard
Introducing our cutting-edge “Risk Management KPI Dashboard | Excel Risk Metrics Report Template | Dynamic Analytics Tool | Decision-Making Companion.” This meticulously crafted, dynamic reporting tool is poised to revolutionize the way you navigate and optimize your risk management processes.
For more details about the template, check the link below;
Crafted with precision using Microsoft Excel and Google Sheets, this digital download transcends the boundaries of a typical spreadsheet – it’s your strategic ally in decision-making.
✨Instant Download: No waiting required. Access your dashboard immediately after purchase.
📊Excel Dashboard: Effortlessly view and manage a wealth of data for comprehensive risk analysis.
📉Risk Management KPI: Track multiple key performance indicators in a centralized location for maximum efficiency.
📝Metrics Report Template: Streamline the creation of detailed reports, allowing you to focus on strategic planning.
🎯Dynamic Analytics Tool: Monitor progress, identify trends, and achieve your risk management objectives with ease.
📑Excel Template: Top-notch design for user-friendly experience, adaptability, and accuracy.
Product Specifications:
💽File Type: XLSX
📈Form/Template: Excel Spreadsheet, Excel Sheet
✅Requirement: Microsoft Excel
💻Compatibility: Google Sheets
🏷️Function: Printable, Decision Making Tool, Data Organizer, Analytics Tool
🌐Access: Fully accessible and easy to use.
Craftsmanship: This isn’t just an Excel sheet; it’s a robust planning tool with meticulous attention to detail. Every element is carefully designed to ensure your success. The tool is easily customizable to suit your exact needs and built to evolve with your risk management strategies.
Digital Materials: Spreadsheet, Microsoft Excel, Excel Spreadsheet, Excel Sheet, Printable, Decision Making Tool, Analytics Tool, Google Sheets, Easy to Use, XLSX, Excel.
Thank you for choosing our product. Your success is a testament to our commitment to creating impactful tools. We appreciate your choice and honor the craftsmanship that goes into developing our products.
Make sure to explore other innovative products in our shop – each meticulously designed to support and enhance your projects. Take your time, and you’ll discover numerous tools to assist, inspire, and elevate your risk management endeavors. Wishing you abundant success!
$ 35 -

Non Profit KPI Dashboard Excel Template, KPI Report, Dynamic Editable Performance Tracking Tool, Reporting File, Ready to Download
Make managing your nonprofit’s performance easier with this dynamic and editable Non Profit KPI Dashboard Excel Template.
Whether you’re tracking donations, volunteer hours, or program impact, this template helps you stay on top of key metrics and make data-driven decisions.
For more details about the template, check the link below;
With this easy-to-use tool, you can customize the dashboard to fit your nonprofit’s unique goals, track progress, and generate clear reports. Ideal for nonprofit organizations, charities, and social enterprises, it saves you time and helps keep your team focused on what matters.
Perfect for nonprofit managers, directors, and anyone responsible for tracking performance and reporting, this template helps simplify your workload.
Key Features:
Fully customizable and editable Excel dashboard
Tracks key nonprofit KPIs like donations, volunteers, and program results
Simple design for easy use, no advanced Excel skills needed
Ready to download and start using immediately
Ideal for nonprofits, charities, and social impact projects
Content:
• Excel file compatible with Excel 2010 and higher (and with sample data)
• Professional Design
• Works both on Mac and Windows
• No installation needed. Ready to use
• Dashboard with charts
• Non-Profit KPI Dashboard Template
• Easy to use
• 100% editable
• Excel file
• Instant download
• Friendly customer support for all your questions
License: Private Use (not for distribution or resale)
$ 35 -

Sales KPI Excel Template | KPI Dashbord Report Template | KPI Report Analysis | Sales Performance Tracking Report | Digital Download
Sales KPI Excel Template
A Sales KPI or metric is a performance measurement that is used by sales teams and by the top management to track the effectiveness of relevant sales activities within a company. These measures help in optimizing your sales performance, sales funnel and sales cycle length.
For more details about the template, check the link below;
Best for:
• Sales KPI Dashboard for all types of companies
• Everyone opening a business
• Sales Professionals
• Everyone starting with a new project
• Sales Managers
This tool will help you analyze your Monthly Kpi Metric data.
After you insert your Monthly Numeric data for the KPI Metrics you determine, you can see a clear monthly and cumulative analysis for the metrics you determine. It is also possible to compare your numeric data with your target data and past year data.
Seeing the level of difference of these metrics will help you identify the problem and how to improve your model more effectively and efficiently.
Content:
• Excel file compatible with Excel 2010 and higher (and with sample data)
• Professional Design
• Works both on Mac and Windows
• No installation needed. Ready to use
• Dashboard with charts
• Sales Kpi Dashboard Excel Template
• Easy to use
• 100% editable
• Excel file
• Instant download
• Friendly customer support for all your questions
License: Private Use (not for distribution or resale)
$ 35 -
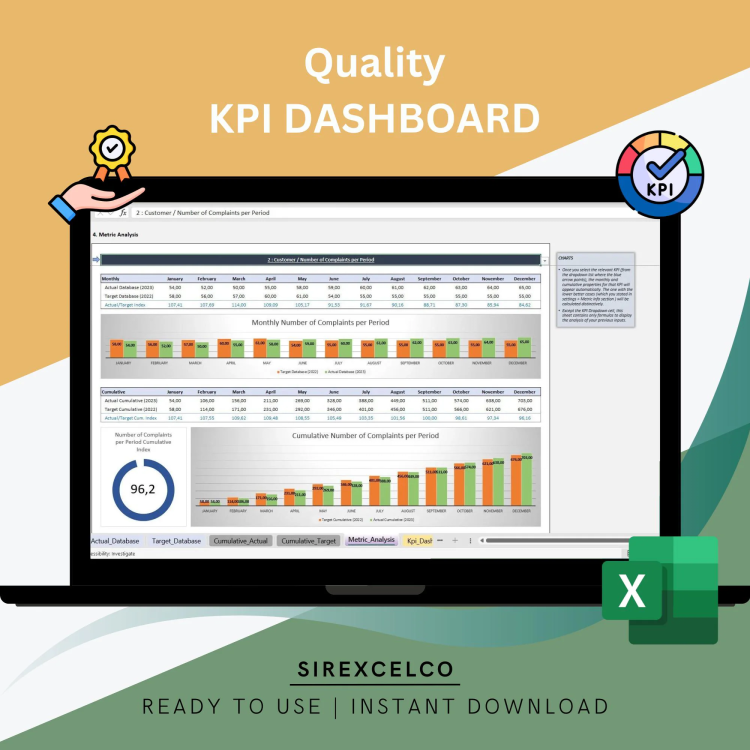
Quality KPI Dashboard Excel Template | Dynamic Monthly Cumulative Metrics Tracker | Target vs Actual Performance Analysis | Digital Download
✨Introducing our Quality KPI Dashboard, an expertly designed Excel KPI Report Template.
With our unique product, you can dynamically enhance your reporting process and effortlessly track the performance of your projects or business.
For more details about the template, check the link below;
🔑Unique Features and Benefits:
📊Complete KPI report template that allows an intuitive understanding of your data
🔄Interactive dashboard that provides a dynamic & comprehensive visual representation of your metrics
📈Equipped with the ability to track performance over various timelines and parameters for a detailed analysis
🎯Perfect tool for decision-making, aiding you to make grounded and informed choices
💡Constructed in Microsoft Excel, a familiar platform that ensures an easy-going experience
🖥️Specs and Materials:
💻Created in an Excel Spreadsheet, compatible with any version of MS Excel
🗂️Easily Printable to have your data at your fingertips during crucial meetings
📑Softcopy (Digital Download) format that allows usage across different devices
🌐Also compatible with Google Sheets and can be easily imported & exported between platforms
🔧Easy-to-use and understand without having any advanced Excel knowledge
✅Available in .xlsx, excel format
Improve your quality management processes with our Quality KPI Dashboard Excel Template! This dynamic and easy-to-use tool allows you to track essential quality metrics month by month and cumulatively. Compare your target metrics with actual performance and visualize your data with dynamic charts that adjust based on the selected metric. Perfect for quality managers, auditors, and business owners, this template helps streamline quality control efforts, providing valuable insights to drive continuous improvement and operational excellence.
Content:
• Excel file compatible with Excel 2010 and higher (and with sample data)
• Professional Design
• Works both on Mac and Windows
• No installation needed. Ready to use
• Dashboard with charts
• Quality KPI Dashboard Template
• Easy to use
• 100% editable
• Excel file
• Instant download
• Friendly customer support for all your questions
License: Private Use (not for distribution or resale)
$ 35 -
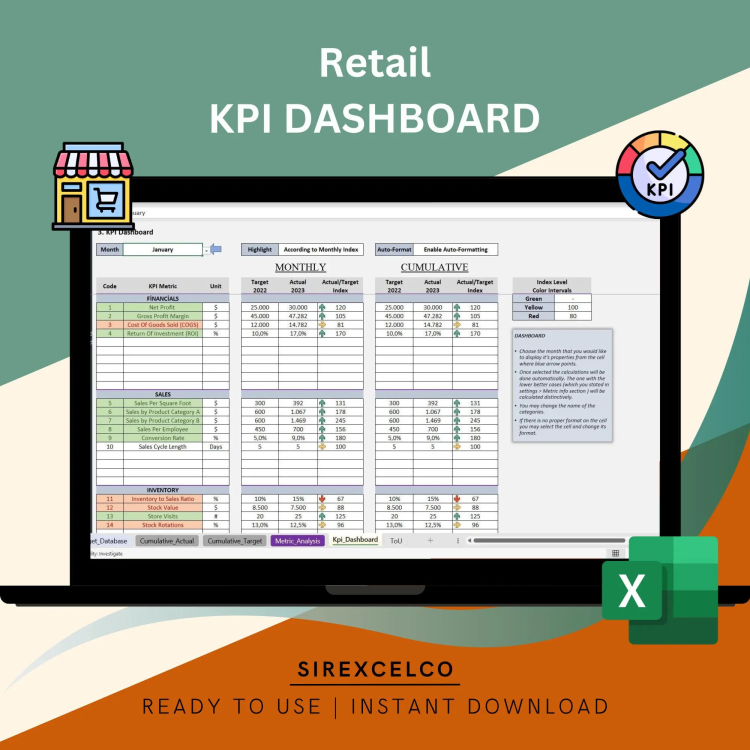
Retail KPI Dashboard Excel Template | Dynamic Monthly & Cumulative Metrics Tracker | Target vs Actual Performance Analysis
Track and analyze your retail business performance with our Retail KPI Dashboard Excel Template!
For more details about the template, check the link below;
This dynamic, easy-to-use template helps you monitor key retail metrics month by month and cumulatively, providing a clear comparison of target metrics versus actual performance. Whether you’re tracking sales, inventory, or customer engagement, this template features dynamic charts that adjust based on the selected metric, giving you real-time insights to make data-driven decisions. Ideal for retail managers and business owners looking to optimize their operational efficiency and performance.
Best for:
• Retail industry
• E-commerce
• Everyone starting with a new project
Content:
• Excel file compatible with Excel 2010 and higher (and with sample data)
• Professional Design
• Works both on Mac and Windows
• No installation needed. Ready to use
• Dashboard with charts
• Retail Kpi Dashboard Template
• Easy to use
• 100% editable
• Excel file
• Instant download
• Friendly customer support for all your questions
License: Private Use (not for distribution or resale)
$ 35 -
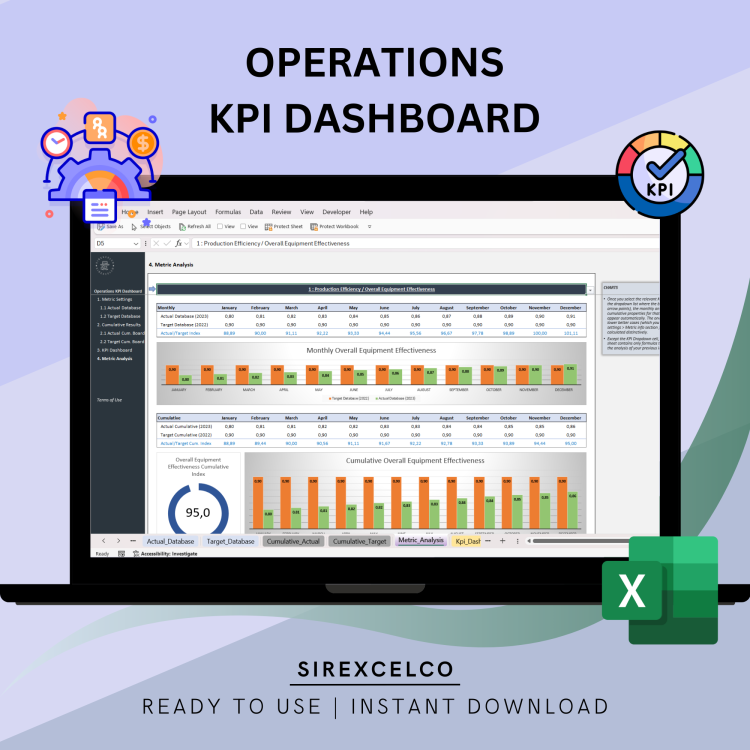
Operations KPI Dashboard Excel Template | Spreadsheet for Business Management | Performance Tracking | Editable Operations KPI Dashboard
This Operations KPI Dashboard Excel Template is perfect for tracking and visualizing your business performance metrics.
For more details about the template, check the link below;
Whether you’re managing a small business or a large enterprise, this customizable Excel dashboard helps you monitor key performance indicators (KPIs) in real-time. With easy-to-use formulas and pre-built charts, you can efficiently track and analyze data to make informed decisions. Download this template today and take control of your business analytics with a professional, user-friendly tool.
Content:
• Excel file compatible with Excel 2010 and higher (and with sample data)
• Professional Design
• Works both on Mac and Windows
• No installation needed. Ready to use
• Dashboard with charts
• Operations KPI Dashboard
• Easy to use
• 100% editable
• Excel file
• Instant download
• Friendly customer support for all your questions
License: Private Use (not for distribution or resale)
$ 35 -

Project Management KPI Report Excel Template | Track Monthly and Cumulative Metrics | Dynamic Charts & Performance Analysis
Take control of your projects with the Project Management KPI Report Excel Template!
For more details about the template, check the link below;
This template makes it easy to monitor your project performance by tracking key metrics month by month and cumulatively. Whether you need to compare target metrics with actual results or visualize progress through dynamic charts, this tool simplifies the process for project managers, team leaders, and business professionals.
No advanced Excel skills are needed to use this fully customizable template. Simply input your project data, choose the metric you want to focus on, and the template will automatically generate reports and charts to keep your projects on track.
Key Features:
Track project management KPIs monthly and cumulatively
Compare target vs actual performance metrics
Dynamic charts that update automatically based on the selected metrics
User-friendly and fully customizable to your project needs
Ideal for project managers, team leads, and business professionals
No advanced Excel knowledge required
This template helps you make data-driven decisions and ensures that your projects are completed efficiently and on time.
Content:
• Excel file compatible with Excel 2010 and higher (and with sample data)
• Professional Design
• Works both on Mac and Windows
• No installation needed. Ready to use
• Dashboard with charts
• Project Management KPI Dashboard Template
• Easy to use
• 100% editable
• Excel file
• Instant download
• Friendly customer support for all your questions
License: Private Use (not for distribution or resale)
$ 35 -

Marketing KPI Report Excel Template | Track Monthly & Cumulative Metrics | Dynamic Charts and Performance Analysis
Take control of your marketing performance with this Marketing KPI Report Excel Template!
For more details about the template, check the link below;
Whether you’re monitoring campaign success, lead generation, or engagement metrics, this template offers a powerful way to track your marketing metrics month by month and cumulatively. You can easily compare target vs actual results and visualize your progress through dynamic charts that automatically update based on the metric you select.
Perfect for marketers, business owners, and marketing professionals, this template requires no advanced Excel skills and is fully customizable to meet your needs. Simply input your data and watch the template do the heavy lifting, helping you make informed, data-driven decisions to improve your marketing efforts.
Key Features:
Track marketing metrics on a monthly and cumulative basis
Compare target vs actual performance
Dynamic charts that update with chosen metrics
User-friendly and easy to customize
Ideal for marketers, business owners, and marketing teams
No advanced Excel skills required
This template is an essential tool for anyone looking to streamline their marketing reporting and make data-backed decisions.
Content:
• Excel file compatible with Excel 2010 and higher (and with sample data)
• Professional Design
• Works both on Mac and Windows
• No installation needed. Ready to use
• Dashboard with charts
• Marketing Kpi Dashboard Excel Template
• Easy to use
• 100% editable
• Excel file
• Instant download
• Friendly customer support for all your questions
License: Private Use (not for distribution or resale)
$ 35 -

Social Media KPI Dashboard Excel Template | Track Social Media Metrics | Monthly & Cumulative Analysis | Dynamic Social Media Reports
Easily track and analyze your social media performance with this Social Media KPI Dashboard Excel Template.
For more details about the template, check the link below;
Ideal for marketers, influencers, and social media managers, this template helps you monitor your monthly and cumulative social media KPIs. Compare actual performance against target metrics, visualize data through dynamic charts, and gain insights to optimize your social media strategies. Whether you’re measuring engagement, growth, or content performance, this template makes managing your social media metrics simple and efficient.
Designed for marketers, influencers, and business owners, this template is incredibly user-friendly and requires no advanced Excel skills. Simply input your data, choose the metric you want to focus on, and the template will automatically generate charts to help you monitor your success.
Key Features:
Track social media metrics monthly and cumulatively
Compare target metrics vs actual performance
Dynamic charts that update based on selected metrics
User-friendly and fully customizable
Perfect for marketers, influencers, and social media managers
No advanced Excel knowledge needed
This template is an essential tool for anyone looking to improve their social media strategy and measure performance with accuracy.
Best for:
• Socal Media Experts
• Bloggers
• Everyone starting with a new project
• Marketing Experts
• Influencers
• Everyone opening a business
This tool will help you analyze your Monthly Kpi Metric data.
After you insert your Monthly Numeric data for the KPI Metrics you determine, you can see a clear monthly and cumulative analysis for the metrics you determine. It is also possible to compare your numeric data with your target data and past year data.
Seeing the level of difference of these metrics will help you identify the problem and how to improve your model more effectively and efficiently.
Content:
• Excel file compatible with Excel 2010 and higher (and with sample data)
• Professional Design
• Works both on Mac and Windows
• No installation needed. Ready to use
• Dashboard with charts
• Social Media KPI Dashboard Template
• Easy to use
• 100% editable
• Excel file
• Instant download
• Friendly customer support for all your questions
License: Private Use (not for distribution or resale)
Thanks for visiting!
$ 35