Electric Bike Dealer Excel Financial Model
$ 150$ 350 (-57%)
To meet your financial planning requirements, the financial analysts at Oak Business Consultant have created this Electric Bike Dealer Excel Financial Model. The model contains the three financial statements and relevant metrics (Sensitivity Analysis, Break-even Analysis, KPIs, ratios, Project evaluation, and dashboard). In addition, the financing options for the project include a standard long-term loan and an investment made by the investors.
Introduction
The precision and depth of analysis provided by this template make it an invaluable asset for motorcycle dealers venturing into the electric bike segment. It encourages a thorough evaluation of project viability, encompassing everything from e-bike sales revenue to the strategic use of funds. With guidance from financial experts, dealers can leverage this model to forecast growth prospects accurately, engage in detailed project evaluation, and establish a sound financial strategy.
Utilizing the Electricity Bike Dealer Excel Financial Model Template
Employing this model effectively equips entrepreneurs with a data-informed, expert-guided approach to navigating the economic landscape of electric bike sales. It lays down a solid foundation for making informed strategic decisions, setting competitive prices, and planning for growth, thereby positioning the business as a promising venture in the rapidly evolving eco-friendly transportation industry.
Key Components
Input Sheet
Revenue Analysis
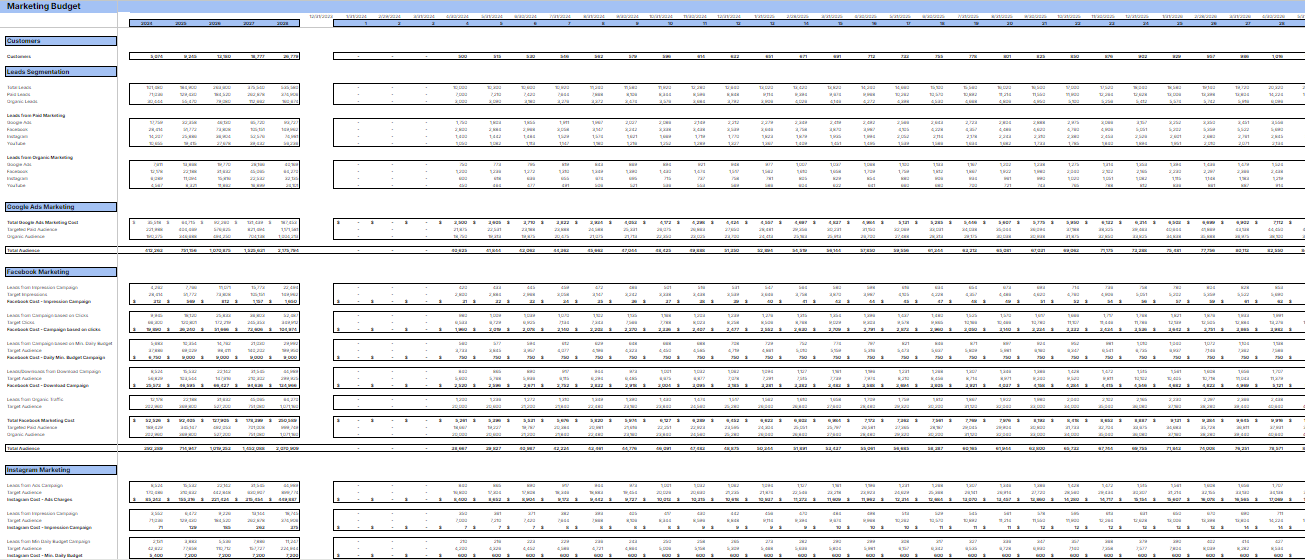
Marketing Budget
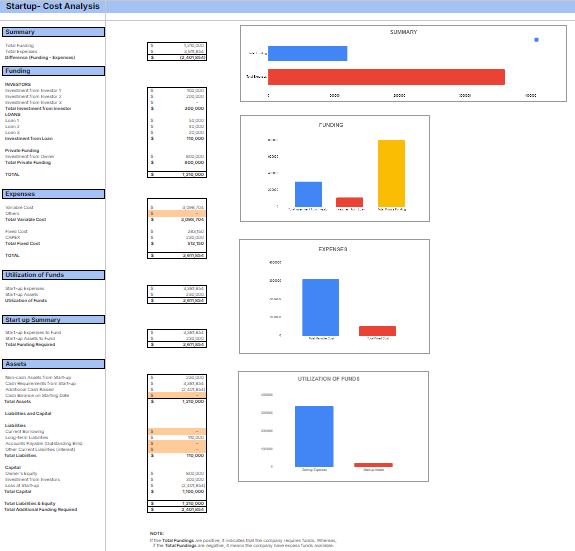
Startup Summary
The Startup Summary encapsulates the initial financial outlay required to launch the e-bike dealership, from securing premises to purchasing the initial inventory of eco-friendly bikes. It offers a clear-eyed view of the capital requirements and financial strategies needed to kickstart the business.
Income Statement
The Income Statement, a critical component of financial reporting, paints a comprehensive picture of the business’s profitability over time. It tracks revenues, costs of goods sold, and operational expenses, culminating in a clear indication of net income, essential for assessing the financial health of the enterprise.
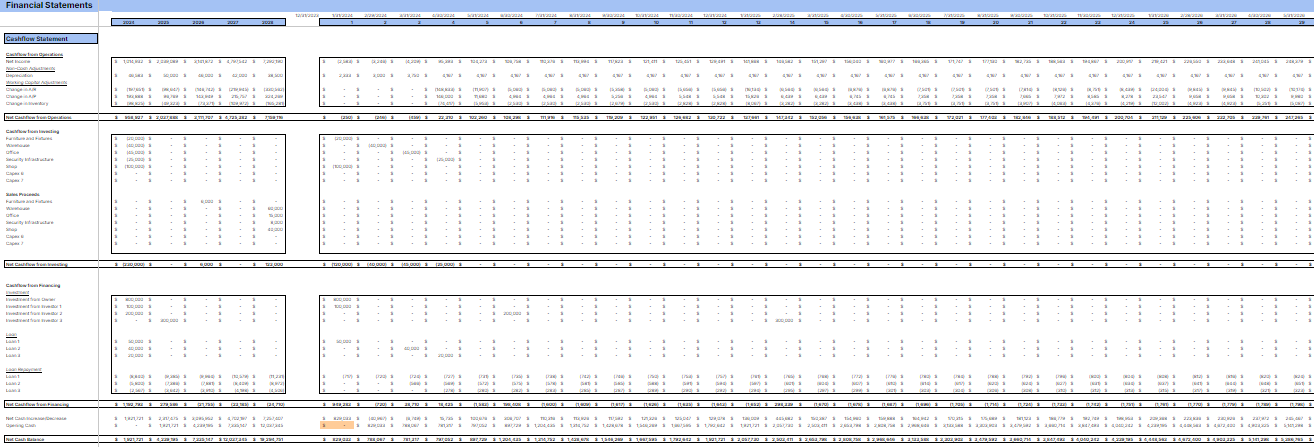
Cashflow Statement
Liquidity and cash management come to the forefront in the Cashflow Statement. This segment sheds light on the inflows and outflows of cash, ensuring that the business maintains adequate liquidity to meet its operational needs and financial obligations.
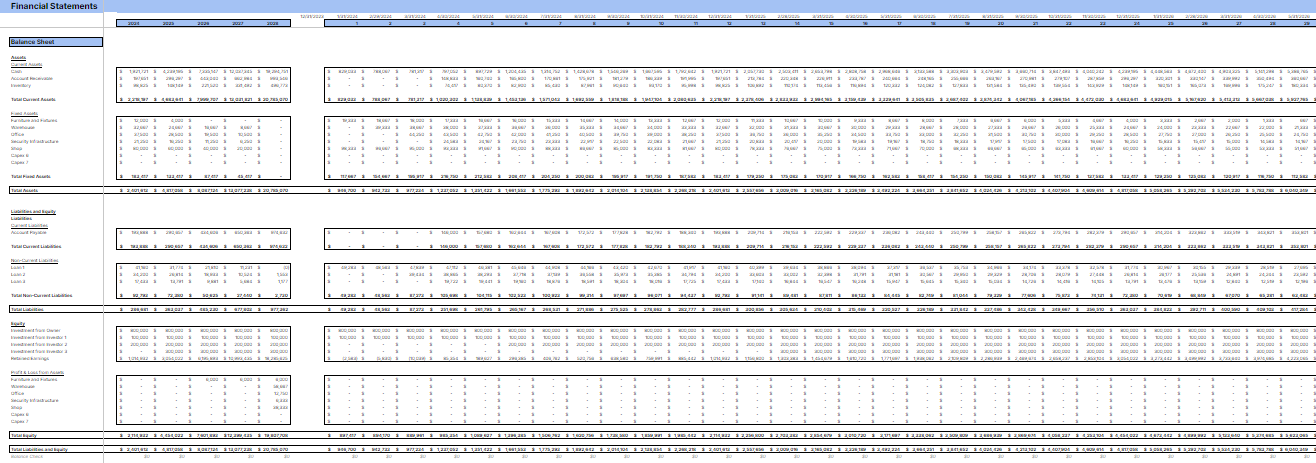
Balance Sheet
The Balance Sheet offers a snapshot of the company’s financial position at a specific point in time, encompassing assets, liabilities, and equity. It is a testament to the business’s stability and financial resilience, serving as a cornerstone for financial analysis and decision-making.
Company Evaluation
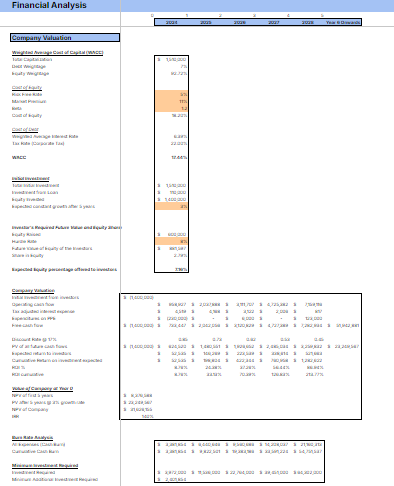
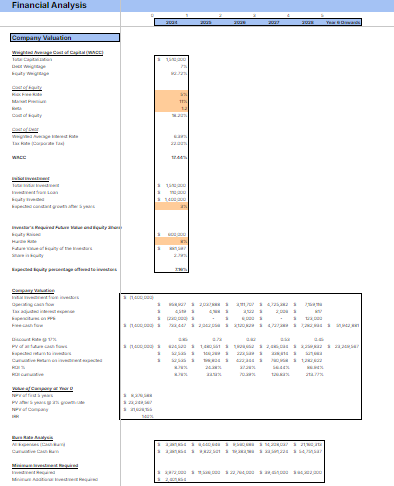
Evaluating the company through the lens of financial metrics and industry benchmarks, this section delves into the valuation of the e-bike dealership, considering factors like market position, revenue potential, and profitability forecasts. It’s a strategic exercise in understanding the company’s worth in the competitive landscape of the e-bike industry.
Break-even Analysis
The Break-even Analysis illuminates the threshold at which the business ceases to operate at a loss and begins to turn a profit. This critical analysis aids in understanding the volume of sales necessary to cover costs, highlighting the path to financial sustainability.
Sensitivity Analysis
Sensitivity Analysis ventures into the realm of what-ifs, exploring how different scenarios impact the financial health of the business. It assesses the resilience of the business model against fluctuations in key variables such as sales volumes, pricing strategies, and cost structures.
KPIs and Ratios
Working Sheet
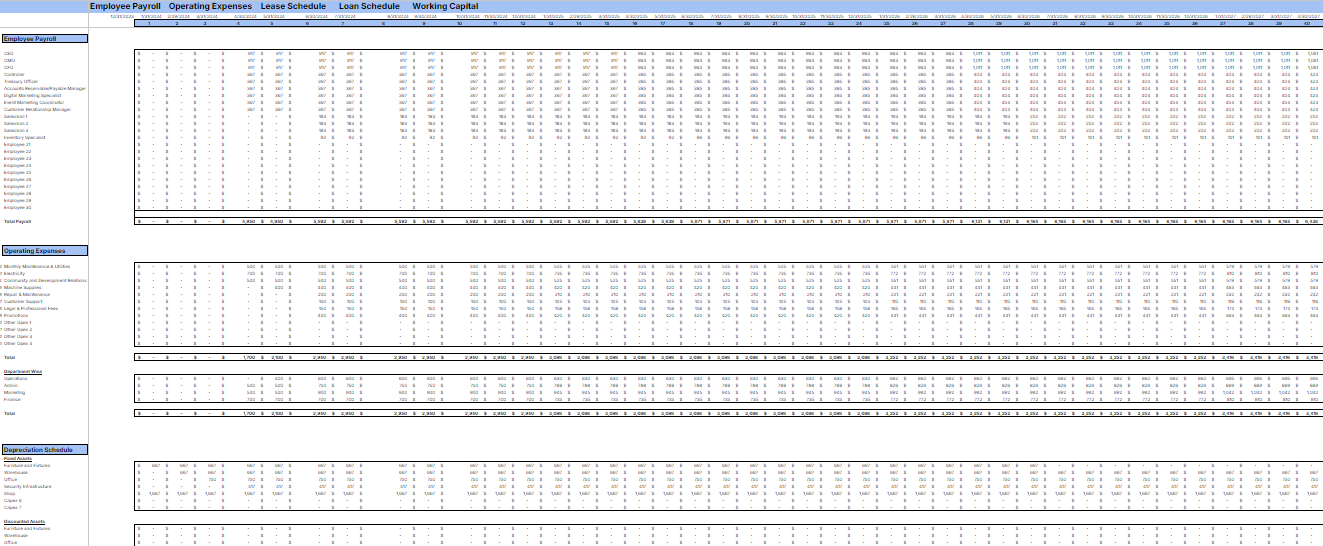
The Working Sheet is the operational backbone of the financial model, where data is processed, and forecasts are generated. It’s a dynamic space where assumptions meet analysis, leading to informed predictions about the business’s financial trajectory.
Dashboard
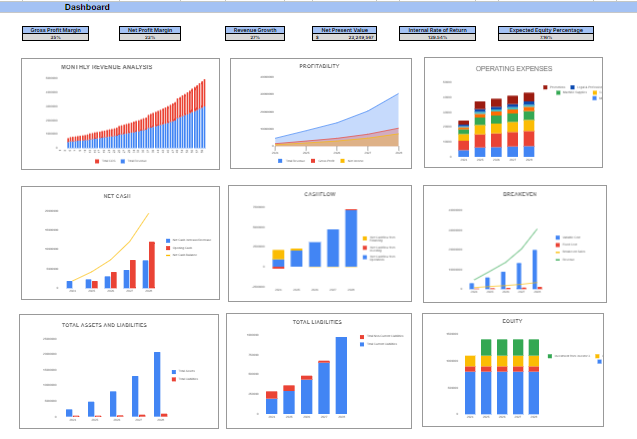
The Dashboard presents a visual summary of the business’s financial health and operational efficiency, offering a quick-glance view of key metrics and trends. It’s designed to provide immediate insights, allowing for swift decision-making and strategic adjustments.
Frequently Asked Questions
What necessitates the acquisition of an Electric Bike Dealer Excel Financial Model?
Which company currently leads in electric bike sales globally?
What Is The Average Annual Revenue Of E-Bike Sales And Rental Businesses In The US?
How Much Profit Margin Do E-Bike Sales And Rental Businesses Typically Achieve?
What Are The Major Cost Components For E-Bike Sales And Rental Businesses?
Major cost components include inventory purchasing (the cost of acquiring e-bikes and components), operational expenses (rent, utilities, staff salaries), marketing and advertising, and maintenance and repair services for rental fleets. Efficient management of these costs is pivotal to maintaining profitability and ensuring the business’s long-term viability.
How Long Does It Take For E-Bike Sales And Rental Businesses To Break Even?
The time to break even for e-bike sales and rental businesses can vary based on initial investment, operating costs, and the effectiveness of the business strategy. Typically, businesses may break even within 2 to 3 years. Achieving a quicker break-even point requires robust sales strategies, cost management, and a focus on high-margin products and services.
What Is The Average Return On Investment (ROI) For E-Bike Sales And Rental Businesses?
The average ROI for e-bike sales and rental businesses can be quite attractive, often ranging from 15% to 25%. This is influenced by factors such as business model efficiency, market positioning, and the ability to tap into growing demand for eco-friendly transportation options. Strategic business planning and financial management are key to maximizing ROI.
What Percentage Of E-Bike Sales And Rental Businesses Experience Growth In Revenue?
Conclusion
Coupled with thefinancial model, at Oak Business Consultant we also offer a detailed business plan and a compellingpitch deck, providing you with all the necessary tools for your Motorcycle Dealership business. We are committed to ensuring your success in the dynamic landscape of Motorcycle Dealer business. Let’s grow your oak of prosperity together. Partner with us at Oak Business Consultants to unlock complete insights into your shoe store financial projections. Our team of experts is dedicated to providing tailored solutions to meet your specific needs and help you achieve your business goals.
Refund Policy
At Oak Business Consultant, we strive to provide high-quality consulting services and products to meet your business needs. However, please note that all sales are final, and we do not offer refunds for any of our products or services.
We encourage you to carefully review all product details, including templates, before making a purchase. If you have any questions or require assistance before purchasing, please feel free to contact us, and we will be happy to help.
Thank you for your understanding.
General Inquiries
There are no inquiries yet.






Reviews
There are no reviews yet.