-

Healthcare KPI Dashboard Excel Template, KPI Report, Dynamic Reporting File, Performance Tracking Report
Healthcare KPI Dashboard
Introducing our “Healthcare KPI Dashboard & Excel KPI Report Template”, the ultimate tool crafted for healthcare professionals seeking effortless dynamic reporting and performance tracking. This innovative tool is not just your average ‘dashboard decor’; it’s a vital assistant that turns your daily data into a seamless dashboard planner.
For more details about the template, check the link below;
📊 SPREADSHEET: A meticulously designed Excel spreadsheet, perfect for crunching numbers, visualizing data, and generating insightful reports.
💼 MICROSOFT EXCEL: Built explicitly for the platform you know and trust. Harness the power of Excel and simplify your complex data interpretation.
🎯 EXCEL SPREADSHEET: A health-specific KPI Excel template with a focus on metrics crucial for performance measurement.
🗂 EXCEL SHEET: Simplify your data organization. Use our Excel sheet as your ride-or-die for data management, be it for patient health tracking, personnel management, or financial planning.
🖨 PRINTABLE: Want to share your findings out of the digital world? Our product comes with easy-to-print options.
🔑 DECISION MAKING TOOL: Transform complex data into actionable insights. Our dashboard helps you make informed decisions, fast and efficient.
👑 DECISION MAKER: This tool gives you the power to make the tough decisions via its intelligent design and high usability.
🧹 ORGANIZING TOOL: Say goodbye to cluttered information and hello to organized, easy-to-understand data.
🌐 GOOGLE SHEETS: For Google lovers, the dashboard is entirely compatible, bringing the same efficiency and clarity.
📂 DIGITAL DOWNLOAD: Instant access post-purchase, no waiting, no shipping fees. Get started right away!
🎯 EASY TO USE: We’ve designed this with you in mind. Its user-friendly interface makes it a breeze to use, even for the non-tech savvy.
📁 XLSX: Offering seamless compatibility with your favourite software, be it MS Excel, Google Sheets or other compatible programs.
Experience the ease and efficiency of our Healthcare KPI Dashboard today. Collect, analyze, and achieve all in one go! Thank you for stopping by. Looking forward to elevating your reporting process with our dashboard.
Please don’t hesitate to reach out if you have any questions, we are always here to help! Enjoy shopping and have a fantastic day!
As healthcare professionals, we understand the importance of data-driven decision-making in providing the best patient care and optimizing healthcare operations. Our Healthcare KPI Dashboard Excel template is designed to empower healthcare practitioners, administrators, and analysts with the tools they need to track and analyze key performance indicators effectively.
Why choose our Healthcare KPI Dashboard?
Streamlined Data Analysis: Our template provides a user-friendly interface that simplifies the process of collecting and analyzing crucial healthcare metrics. No more sifting through stacks of papers or struggling with complex spreadsheets. Our dashboard consolidates all the essential KPIs in one place, allowing you to focus on what matters most – improving patient outcomes.
Comprehensive Metrics: Our template covers a wide range of healthcare KPIs, ensuring you have a holistic view of your organization’s performance. From patient satisfaction and readmission rates to average length of stay and revenue per procedure, our dashboard provides insights into every aspect of your healthcare operations.
Customizable and Easy to Use: We understand that every healthcare organization is unique, and that’s why our template is fully customizable. Tailor it to your specific needs by adding or removing KPIs, adjusting timeframes, and customizing visualizations. Even if you’re not an Excel expert, our intuitive design makes it easy to navigate and update your data effortlessly.
Time and Cost Savings: By automating data collection and analysis, our Healthcare KPI Dashboard saves you valuable time and resources. Say goodbye to manual data entry and complex calculations. With just a few clicks, you’ll have real-time insights into your healthcare performance, allowing you to make informed decisions quickly.
Who can benefit from our Healthcare KPI Dashboard?
• Healthcare administrators: Track key metrics to optimize resource allocation, improve efficiency, and enhance patient experience.
• Hospital managers: Monitor patient flow, readmission rates, and revenue per procedure to identify areas for improvement.
• Medical practitioners: Analyze patient satisfaction and clinical outcomes to enhance the quality of care provided.
• Healthcare analysts: Extract actionable insights from data trends and identify opportunities for operational enhancements.
Content:
• Excel file compatible with Excel 2010 and higher (and with sample data)
• Professional Design
• Works both on Mac and Windows
• No installation needed. Ready to use
• Dashboard with charts
• Healthcare KPI Dashboard Template
• Easy to use
• 100% editable
• Excel file
• Instant download
• Friendly customer support for all your questions
License: Private Use (not for distribution or resale)
$ 35 -

HR KPI Dashboard Excel Template, Human Resource Excel Kpi Report Template, Dynamic Reporting Dashboard Xlsx, Performance Tracking Report
Introducing our exclusive 🏆 HR KPI Dashboard | Human Resource Excel Kpi Report Template | Dynamic Reporting Dashboard | Performance Tracking Report.
Created for efficiency and smooth operation, this template is your perfect companion for tracking and analyzing HR metrics effortlessly.
For more details about the template, check the link below;
✔️ 😎 Unique features include:
1. 📈 Dynamic Reporting Dashboard: Gain comprehensive visibility into your human resource performance with our real-time, interactive dashboard. Customize views according to needs, and convert data into meaningful decisions.
2. 🖇️ Human Resource Excel Kpi Report Template: Take control of workforce planning and adjust strategies with precision. In a few clicks, evaluate key areas such as recruitment, retention, training, and more.
3. 📊 Performance tracking report: Never miss a beat with systematic performance tracking. Identify areas for improvement and recognize excellence all through one simplified report.
💻 Material: 100% Excel-based for seamless compatibility and function. Easy to use, modify, and integrate, our HR KPI Dashboard is all you need to elevate your business’ HR practices.
🎁 Don’t lose out on harnessing the power of data for your organization with this incredibly intuitive and user-friendly tool. Treat your business today to streamlining processes, identifying trends thus making informed decisions to drive productivity and engagement.
💖 Thank you for considering our HR KPI Dashboard for your human resource management and performance tracking needs. Don’t forget to check out our shop for even more resourceful solutions to support your mission for operational excellence. 💝
🙏 We appreciate your support and strive to serve you better, always! You deserve nothing but the best!
$ 35 -

Manufacturing KPI Report Excel Template | Track Monthly & Cumulative Metrics | Dynamic Charts and Performance Analysis
Efficiently track and manage your manufacturing performance with the Manufacturing KPI Report Excel Template!
For more details about the template, check the link below;
This template helps you measure essential manufacturing metrics month by month and cumulatively, allowing you to compare target metrics vs actual performance. With dynamic charts that update as you select specific metrics, you can easily visualize progress and identify areas for improvement.
Perfect for production managers, plant operators, and manufacturing professionals, this template is simple to use and requires no advanced Excel skills. It’s fully customizable to suit your specific manufacturing needs. Just input your data, and the template does the rest, making it an essential tool for boosting efficiency and productivity in your operations.
Key Features:
Track manufacturing KPIs on a monthly and cumulative basis
Compare actual performance vs target metrics
Dynamic charts that adjust with selected metrics
User-friendly, no advanced Excel knowledge needed
Fully customizable for different manufacturing needs
Perfect for production managers and manufacturing teams
This template is the ultimate tool for optimizing your manufacturing process and making data-driven decisions with ease.
Best for:
• Manufacturers
• Production businesses
• SMB & SME Companies
• Automotive
• Industrial Businesses
• SMB & SME Companies
Content:
• Excel file compatible with Excel 2010 and higher (and with sample data)
• Professional Design
• Works both on Mac and Windows
• No installation needed. Ready to use
• Dashboard with charts
• Manufacturing KPI Dashboard Template
• Easy to use
• 100% editable
• Excel file
• Instant download
• Friendly customer support for all your questions
License: Private Use (not for distribution or resale)
$ 35 -

Marketing KPI Report Excel Template | Track Monthly & Cumulative Metrics | Dynamic Charts and Performance Analysis
Take control of your marketing performance with this Marketing KPI Report Excel Template!
For more details about the template, check the link below;
Whether you’re monitoring campaign success, lead generation, or engagement metrics, this template offers a powerful way to track your marketing metrics month by month and cumulatively. You can easily compare target vs actual results and visualize your progress through dynamic charts that automatically update based on the metric you select.
Perfect for marketers, business owners, and marketing professionals, this template requires no advanced Excel skills and is fully customizable to meet your needs. Simply input your data and watch the template do the heavy lifting, helping you make informed, data-driven decisions to improve your marketing efforts.
Key Features:
Track marketing metrics on a monthly and cumulative basis
Compare target vs actual performance
Dynamic charts that update with chosen metrics
User-friendly and easy to customize
Ideal for marketers, business owners, and marketing teams
No advanced Excel skills required
This template is an essential tool for anyone looking to streamline their marketing reporting and make data-backed decisions.
Content:
• Excel file compatible with Excel 2010 and higher (and with sample data)
• Professional Design
• Works both on Mac and Windows
• No installation needed. Ready to use
• Dashboard with charts
• Marketing Kpi Dashboard Excel Template
• Easy to use
• 100% editable
• Excel file
• Instant download
• Friendly customer support for all your questions
License: Private Use (not for distribution or resale)
$ 35 -

Non Profit KPI Dashboard Excel Template, KPI Report, Dynamic Editable Performance Tracking Tool, Reporting File, Ready to Download
Make managing your nonprofit’s performance easier with this dynamic and editable Non Profit KPI Dashboard Excel Template.
Whether you’re tracking donations, volunteer hours, or program impact, this template helps you stay on top of key metrics and make data-driven decisions.
For more details about the template, check the link below;
With this easy-to-use tool, you can customize the dashboard to fit your nonprofit’s unique goals, track progress, and generate clear reports. Ideal for nonprofit organizations, charities, and social enterprises, it saves you time and helps keep your team focused on what matters.
Perfect for nonprofit managers, directors, and anyone responsible for tracking performance and reporting, this template helps simplify your workload.
Key Features:
Fully customizable and editable Excel dashboard
Tracks key nonprofit KPIs like donations, volunteers, and program results
Simple design for easy use, no advanced Excel skills needed
Ready to download and start using immediately
Ideal for nonprofits, charities, and social impact projects
Content:
• Excel file compatible with Excel 2010 and higher (and with sample data)
• Professional Design
• Works both on Mac and Windows
• No installation needed. Ready to use
• Dashboard with charts
• Non-Profit KPI Dashboard Template
• Easy to use
• 100% editable
• Excel file
• Instant download
• Friendly customer support for all your questions
License: Private Use (not for distribution or resale)
$ 35 -
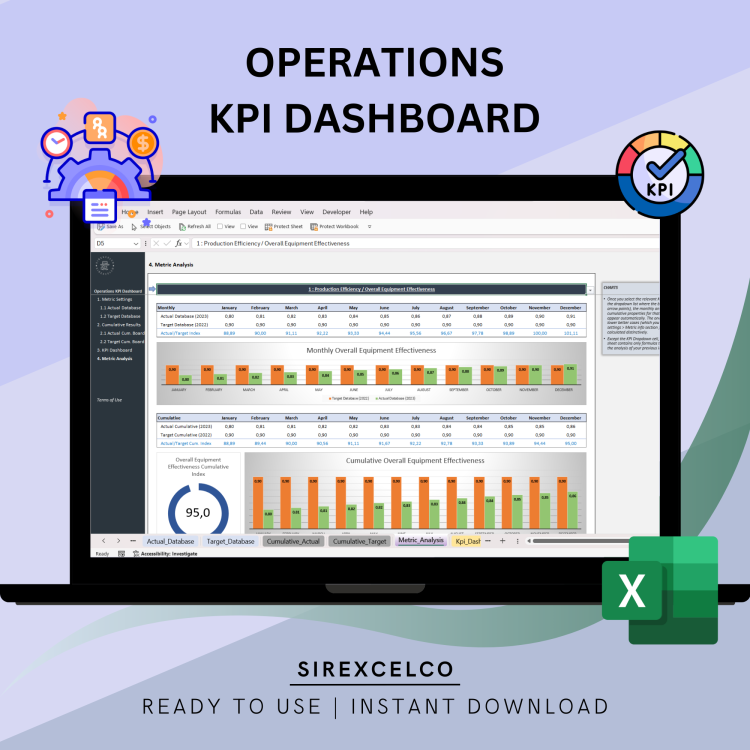
Operations KPI Dashboard Excel Template | Spreadsheet for Business Management | Performance Tracking | Editable Operations KPI Dashboard
This Operations KPI Dashboard Excel Template is perfect for tracking and visualizing your business performance metrics.
For more details about the template, check the link below;
Whether you’re managing a small business or a large enterprise, this customizable Excel dashboard helps you monitor key performance indicators (KPIs) in real-time. With easy-to-use formulas and pre-built charts, you can efficiently track and analyze data to make informed decisions. Download this template today and take control of your business analytics with a professional, user-friendly tool.
Content:
• Excel file compatible with Excel 2010 and higher (and with sample data)
• Professional Design
• Works both on Mac and Windows
• No installation needed. Ready to use
• Dashboard with charts
• Operations KPI Dashboard
• Easy to use
• 100% editable
• Excel file
• Instant download
• Friendly customer support for all your questions
License: Private Use (not for distribution or resale)
$ 35 -
OpEx – Apply Six Sigma to Process Control and Improvement
Six Sigma for Process Control and Improvement
This document outlines a comprehensive Six Sigma training programme, focusing on process control and improvement using the DMAIC (Define, Measure, Analyse, Improve, Control) methodology. The material introduces Six Sigma as a framework for reducing variation and improving customer satisfaction through data-driven problem-solving, aiming for a performance level of 3.4 defects per million opportunities. It details each phase of DMAIC, providing specific tools and techniques, such as project charters, data collection plans, cause and effect diagrams, and control charts. The training incorporates practical simulations, like the “X Pult” exercise, to demonstrate the application of these methods in identifying problems, measuring performance, analysing root causes, implementing solutions, and sustaining improvements within an organisational context.$ 59$ 64 -
OpEx – Kaizen, Continuous Improvement
Facilitating Kaizen
The provided document, “OpEx-Facilitate CI-Kaizen.pdf” by Vishnu Rayapeddi, introduces Kaizen, a Japanese concept meaning gradual and orderly continuous improvement. It outlines a structured approach to fostering an organisational culture of sustained improvement by eliminating waste through various activities. The text highlights different types of Kaizen activities, including “Quick and Easy Kaizen” for daily small improvements and “Kaizen Events” (also known as “Kaizen Blitz”) for targeted, accelerated improvements. The Plan-Do-Check-Act (PDCA) cycle is presented as the core process for continuous improvement, emphasising the importance of standardising new processes to prevent regression. The document also details the planning, implementation, and follow-up phases for Kaizen events, suggesting a comprehensive framework for achieving operational excellence.$ 39$ 44 -
OpEx – Poka-Yoke (Mistake Proofing)
Poka-Yoke: The Art of Mistake Proofing
The source, titled “OpEx – Poka Yoke Mistake proofing.pdf,” outlines a comprehensive approach to achieving operational excellence through mistake-proofing, also known as Poka-Yoke. It emphasises that defects account for a significant portion of production costs and stresses the importance of preventing errors at the source rather than merely inspecting them out. The document introduces principles for achieving zero defects, focusing on process control over individual blame, and explores various categories of error and their prevention strategies. It details six mistake-proofing techniques—elimination, replacement, prevention, facilitation, detection, and mitigation—providing examples for each. Finally, it presents a seven-step framework for implementing error-proofing and a five-part project methodology for designing defects out of processes, encouraging continuous improvement and team invol$ 34$ 39OpEx – Poka-Yoke (Mistake Proofing)
$ 34$ 39 -
OpEx – Process Optimization using Six Sigma Techniques
Optimizing Costs
This presentation, “OpEx – Optimise Cost,” by Vishnu Rayapeddi, outlines strategies for operational excellence focused on cost optimisation. It begins by explaining the importance of understanding customer needs and how they define quality, alongside methods for analysing cost and waste components. The document highlights various types of waste in manufacturing, such as defects, overproduction, and excessive motion, and offers practical exercises for identifying and reducing these costs. Furthermore, it introduces the concept of pull systems in production, contrasting them with traditional push systems to demonstrate their benefits in reducing operational costs and inventory. The presentation concludes by emphasising the importance of measuring results and implementing continuous improvement projects to achieve significant cost reductions and enhance customer satisfaction.$ 69$ 74 -
OpEx – The Lean Office
Lean Thinking for Office and Admin Areas
This document, “OpEx_Lean_Office.pdf,” is a presentation by Vishnu Rayapeddi from Productivity Solutions (PSL) on Lean Thinking for Office & Admin Areas, copyrighted in 2011. It serves as a gateway to operational excellence, detailing various best-class practices such as Lean, Six Sigma, Total Quality Management (TQM), and the Theory of Constraints (TOC). The presentation’s core focuses on defining operational excellence and the elimination of waste through structured approaches like the Toyota Production System (TPS). It outlines a three-part methodology to “Lean your Business”: stabilise processes, standardise processes, and simplify processes, with practical tools and activities for each stage. The document ultimately aims to foster a continuous improvement culture within organisations to enhance productivity and reduce costs.$ 69$ 74OpEx – The Lean Office
$ 69$ 74 -