-
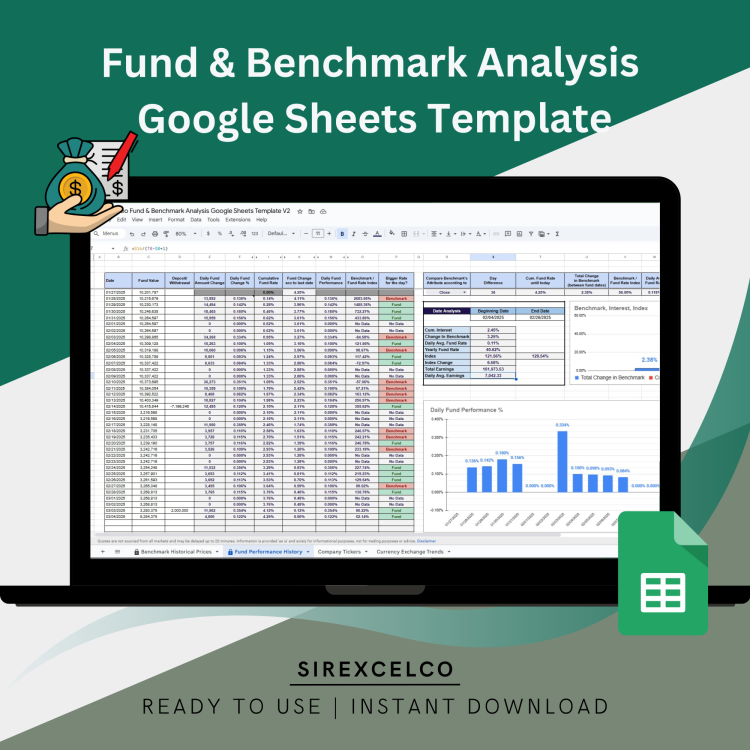
Fund & Benchmark Analysis Google Sheets Template | Investment Analytics | Performance Tracking | Compare Funds with Custom Benchmarks
Easily track your investment performance with this Google Sheets Fund Performance Tracker.
For more details about the template, check the link below;
This dynamic and easy-to-use template helps investors analyze their fund’s daily performance while comparing it to a custom benchmark—whether it’s a currency, stock, or mutual fund. Get insights on Cumulative Interest, Benchmark Changes, Daily & Yearly Fund Rates, Total Earnings, and more. Simply enter your data, and the template automatically generates key analytics and comparisons. Perfect for investors looking for a structured and insightful way to monitor and optimize their portfolio performance.
$ 40 -

Database-Driven KPI Dashboard Excel Template | Monthly YoY Analysis | Metric Analysis by Entering Data in a Database | Performance Report
Database-Driven KPI Dashboard
Streamline your KPI tracking with this Database-Driven KPI Dashboard Excel Template. Unlike standard templates, this tool allows you to enter data into a database, automatically calculating values and ratios for monthly and cumulative performance tracking. Easily compare your metrics against targets or analyze year-over-year (YoY) performance with dynamic charts and visualizations. Perfect for business professionals and owners looking for an intuitive way to track and compare key metrics. This template simplifies data entry, aggregates results, and provides actionable insights, making it a must-have for performance analysis.
For more details about the template, check the link below;
Content:
• Excel file compatible with Excel 2010 and higher (and with sample data)
• Professional Design
• Works both on Mac and Windows
• No installation needed. Ready to use
• Dashboard with charts
• Database-Driven KPI Dashboard Excel Template
• Easy to use
• 100% editable
• Excel file
• Instant download
• Friendly customer support for all your questions
License: Private Use (not for distribution or resale)
$ 40 -
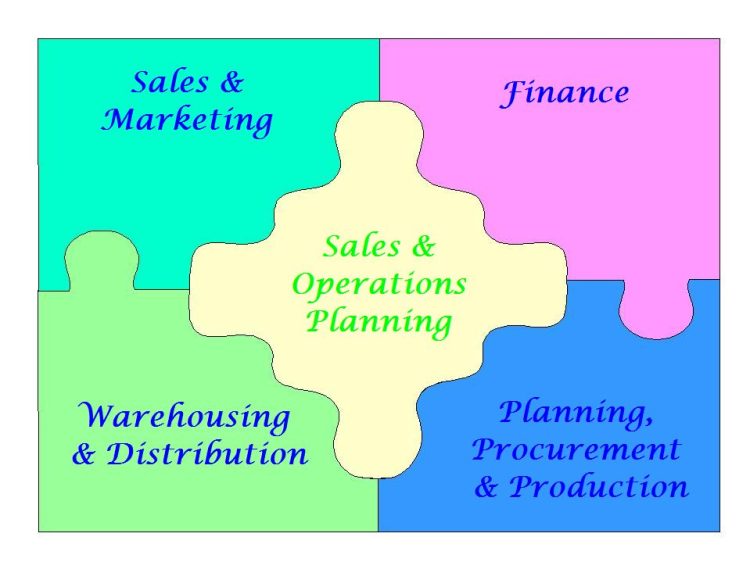
OpEx- – Sales & Operations Planning
The source, “OpEx – SCM Funda1 S&OP.pdf” by Vishnu Rayapeddi, provides a comprehensive overview of Sales & Operations Planning (S&OP). It outlines the objectives, processes, and foundational elements necessary for successful S&OP implementation, highlighting its role in integrating various business functions to achieve competitive advantage. The document also addresses common industry challenges that S&OP aims to resolve, such as stock-outs and excessive inventory, and details the benefits derived from its adoption, including improved operational efficiency and enhanced communication. Furthermore, the text explores the practical application of S&OP through a case study of Kiwi Meats and introduces Integrated Business Planning (IBP) as an evolution of S&OP, emphasising its capacity for more profit-driven and executive-engaged planning across the entire enterprise.
$ 39$ 44OpEx- – Sales & Operations Planning
$ 39$ 44 -
OpEx – Inventory Management
This source provides an extensive overview of inventory management within supply chain fundamentals. It introduces Vishnu Rayapeddi as the author, highlighting their significant experience and qualifications in the field. The text thoroughly defines inventory and inventory management, outlining key objectives such as customer service and cost minimisation. Various types of inventory are explored, alongside the costs associated with inventory, including holding, ordering, and shortage costs. The document also differentiates between independent and dependent demand and explains various order quantity strategies, focusing on the Economic Order Quantity (EOQ) model and the Quantity Discount Model, complete with practical examples. Furthermore, it details ABC analysis for inventory categorisation, its procedural steps, and implications for inventory management policies, including cycle counting and different inventory valuation methods like FIFO, LIFO, and Weighted Average. Finally, the text briefly touches upon Kanban systems as a method for production control.
$ 39$ 44OpEx – Inventory Management
$ 39$ 44 -
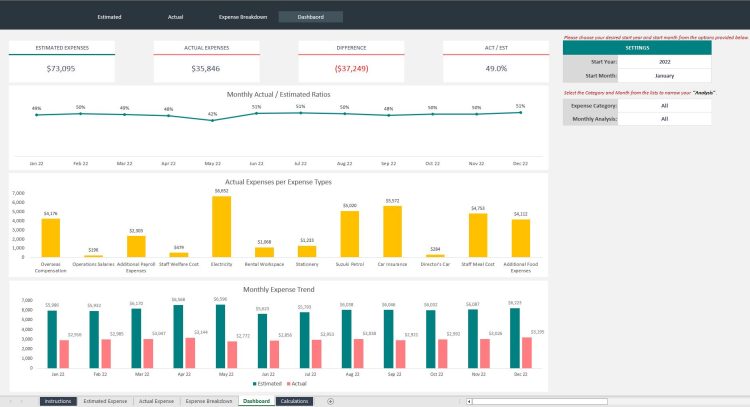
Expense Analysis Excel Template
This spreadsheet is a comprehensive tool for monthly spend analysis, including actual and estimated costs.
$ 39 -

Dynamic Appointment Scheduler / Calendar Monthly View
Dynamic Appointment Scheduler made on Excel Template.
$ 39 -

Supply Chain and Logistics KPI Dashboard, Excel Template, Dynamic Reporting Dashboard Sheets, Performance Tracking XLSX
Supply Chain and Logistics KPI Dashboard
A logistics KPI or metric is a performance measurement that is used by logistics managers to track, visualize and optimize all relevant logistic processes in an efficient way.
For more details about the template, check the link below;
Best for:
• Logistics Managers
• Operation Managers
• Shipping Businesses
• Transportation Businesses
• Order management
• Delivery Businesses
This tool will help you analyze your Monthly Kpi Metric data.
After you insert your Monthly Numeric data for the KPI Metrics you determine, you can see a clear monthly and cumulative analysis for the metrics you determine. It is also possible to compare your numeric data with your target data and past year data.
Seeing the level of difference of these metrics will help you identify the problem and how to improve your model more effectively and efficiently.
Content:
• Excel file compatible with Excel 2010 and higher (and with sample data)
• Professional Design
• Works both on Mac and Windows
• No installation needed. Ready to use
• Dashboard with charts
• Supply Chain and Logistics KPI Dashboard
• Easy to use
• 100% editable
• Excel file
• Instant download
• Friendly customer support for all your questions
License: Private Use (not for distribution or resale)
$ 35 -

Customer Success KPI Excel Template,KPI Metric Report | KPI Dashbord Excel Template, Performance Tracking Report, Digital Download
Indulge in the wonders of data organization with our Customer Success KPI Template!
For more details about the template, check the link below;
Fresh, cutting-edge, and meticulously designed, this KPI Dashboard & Tracker exists to streamline your marketing efforts and provide a rich visual overview of your business’s key performance metrics. Crafted with precision and integrity, this KPI Dashboard Excel Template is both versatile and easy to use, making it the perfect tool for any business owner, marketer, or data enthusiast.
📊 **Powerful KPI Dashboard:** Fast track your success with effectively organized data. No need for complicated set up! Our dashboard provides a visually stunning overview at-a-glance of your business’s critical metrics.
💼 **KPI Tracker:** Gauge your business performance with minimum effort. Our KPI Tracker is purposely built to keep track of all significant metrics, allowing you to make informed and strategic business decisions.
📈 **KPI Marketing Template Sheet:** Streamline and elevate your marketing efforts. Our marketing template sheet enables you to effortlessly track the effectiveness of your marketing campaigns, strategies, and initiatives.
🔧 **Easy to Use:** You don’t have to be an Excel wizard! The template is designed with user-friendliness in mind; its simplicity makes it understandable and manageable for all, regardless of their technical prowess.
🌍 **Instant Digital Download:** Get instant access! Once the purchase is complete, the Excel file is ready for download and immediate use.
✅ **Editable:** Tailor the template to suit your business needs! Our product is fully editable, providing flexibility and personalization to better serve your business.
⌨️ **Material:** This is a digital product crafted entirely in Excel, ensuring familiarity and ease of use for Microsoft Office users.
🎁 **Perfect for Gifting:** Know someone who could use a bit of organizational ease? This makes an excellent and thoughtful gift for entrepreneurs, small business owners, or marketers in your life!
Thank you for checking out my shop! Your support means the world to me. Feel free to reach out if you have any queries or need further assistance with our products. Happy tracking!
$ 35 -

General Management KPI Dashboard | Excel KPI Report Template | Dynamic Reporting Dashboard | Performance Tracking Report
Introducing our Excel Template General Management KPI Dashboard!
For more details about the template, check the link below;
In the fast-paced world of business, effective management is essential for success. Our General Management KPI Dashboard Excel template is designed to provide managers, executives, and professionals with a comprehensive tool to track and analyze key performance indicators, empowering them to make data-driven decisions and drive business growth.
Why choose our General Management KPI Dashboard?
Enhanced Decision-making: Our template offers a centralized platform for monitoring and analyzing crucial business metrics. By consolidating key performance indicators in one place, our dashboard provides a clear and concise overview of your organization’s performance. Make informed decisions, identify trends, and take proactive measures to optimize your business operations.
Wide Range of Metrics: Our template covers a diverse set of KPIs relevant to general management. From financial indicators such as revenue, profit margins, and cash flow to operational metrics like employee productivity, customer satisfaction, and project success rates, our dashboard equips you with a holistic view of your organization’s performance.
Customizable and User-friendly: We understand that each business has unique needs and requirements. Our template is fully customizable, allowing you to tailor it to your specific objectives. Add or remove KPIs, adjust timeframes, and personalize visualizations to match your preferences. With an intuitive interface, our dashboard is easy to navigate, even for those without advanced Excel skills.
Time and Resource Efficiency: Automate data collection and analysis with our General Management KPI Dashboard, saving you valuable time and resources. No more manual data entry or complex calculations. With just a few clicks, you can access real-time insights and trends, empowering you to respond swiftly to challenges and seize opportunities.
Who can benefit from our General Management KPI Dashboard?
• Business executives: Gain a comprehensive overview of your company’s performance, identify areas for improvement, and make strategic decisions to drive growth.
• Department managers: Track team productivity, project success rates, and customer satisfaction to optimize operational efficiency and performance.
• Entrepreneurs: Monitor financial metrics, cash flow, and sales performance to assess the health and growth potential of your business.
• Business analysts: Extract valuable insights from data trends and make data-driven recommendations to enhance business processes.
Invest in our General Management KPI Dashboard Excel template and unlock the power of data-driven decision-making in your organization. Streamline your management practices, drive performance, and achieve your business objectives. Get started today!
Content:
• Excel file compatible with Excel 2010 and higher (and with sample data)
• Professional Design
• Works both on Mac and Windows
• No installation needed. Ready to use
• Dashboard with charts
• General Management KPI Dashboard Template
• Easy to use
• 100% editable
• Excel file
• Instant download
• Friendly customer support for all your questions
License: Private Use (not for distribution or resale)
$ 35 -

Manufacturing KPI Report Excel Template | Track Monthly & Cumulative Metrics | Dynamic Charts and Performance Analysis
Efficiently track and manage your manufacturing performance with the Manufacturing KPI Report Excel Template!
For more details about the template, check the link below;
This template helps you measure essential manufacturing metrics month by month and cumulatively, allowing you to compare target metrics vs actual performance. With dynamic charts that update as you select specific metrics, you can easily visualize progress and identify areas for improvement.
Perfect for production managers, plant operators, and manufacturing professionals, this template is simple to use and requires no advanced Excel skills. It’s fully customizable to suit your specific manufacturing needs. Just input your data, and the template does the rest, making it an essential tool for boosting efficiency and productivity in your operations.
Key Features:
Track manufacturing KPIs on a monthly and cumulative basis
Compare actual performance vs target metrics
Dynamic charts that adjust with selected metrics
User-friendly, no advanced Excel knowledge needed
Fully customizable for different manufacturing needs
Perfect for production managers and manufacturing teams
This template is the ultimate tool for optimizing your manufacturing process and making data-driven decisions with ease.
Best for:
• Manufacturers
• Production businesses
• SMB & SME Companies
• Automotive
• Industrial Businesses
• SMB & SME Companies
Content:
• Excel file compatible with Excel 2010 and higher (and with sample data)
• Professional Design
• Works both on Mac and Windows
• No installation needed. Ready to use
• Dashboard with charts
• Manufacturing KPI Dashboard Template
• Easy to use
• 100% editable
• Excel file
• Instant download
• Friendly customer support for all your questions
License: Private Use (not for distribution or resale)
$ 35 -

Call Center KPI Dashboard Excel Template, Excel KPI Report Template, Dynamic Reporting Dashboard Sheets, Performance Tracking Report File
Introducing our Excel Template Call Center KPI Dashboard!
For more details about the template, check the link below;
Are you looking to enhance the performance of your call center operations and deliver exceptional customer service? Look no further! Our Call Center KPI Dashboard Excel template is the ultimate tool for call center managers, supervisors, and business owners who want to track and analyze key performance indicators (KPIs) related to call center operations.
Why choose our Call Center KPI Dashboard?
Comprehensive Insights: Our template provides a comprehensive overview of your call center’s performance. From call volume and response time to average handling time and customer satisfaction scores, you’ll have valuable insights into your call center operations. Stay informed, identify trends, and make data-driven decisions to optimize your customer service.
Diverse KPI Coverage: We’ve got you covered with a wide range of essential call center KPIs. Monitor metrics such as first call resolution, service level agreements (SLAs) compliance, agent occupancy, and customer churn rate. These insights empower you to improve efficiency, enhance agent performance, and deliver outstanding customer experiences.
Customizable and User-friendly: Our template is fully customizable to fit your specific call center requirements. Tailor it by adding or removing KPIs, adjusting timeframes, and customizing visualizations to align with your call center goals. Our user-friendly interface makes it easy for anyone to navigate and update data effortlessly.
Time and Resource Efficiency: Our Call Center KPI Dashboard saves you valuable time and resources by automating data collection and analysis. No more manual data entry or complex calculations. With real-time insights and visually appealing charts, you can quickly identify areas for improvement, optimize staffing levels, and enhance call center performance.
Who can benefit from our Call Center KPI Dashboard?
• Call Center Managers: Monitor and improve call center performance, track key metrics, and make data-driven decisions to enhance operational efficiency.
• Supervisors: Track agent performance, monitor call quality, and identify training needs to ensure consistent service delivery.
• Business Owners: Gain insights into customer satisfaction, call center efficiency, and customer experience to make informed strategic decisions.
Content:
• Excel file compatible with Excel 2010 and higher (and with sample data)
• Professional Design
• Works both on Mac and Windows
• No installation needed. Ready to use
• Dashboard with charts
• Call Center KPI Dashboard Template
• Easy to use
• 100% editable
• Excel file
• Instant download
• Friendly customer support for all your questions
License: Private Use (not for distribution or resale)
$ 35