



-
Rental Property Model – Ready to use
The Rental Property Financial Model is designed to help real estate investors, property managers, and finance professionals evaluate rental property acquisitions and project long-term investment returns. Whether you are analyzing a single duplex or a 25-unit apartment complex, this model provides the analytical framework to make informed buy/hold/sell decisions.
The model answers key investment questions:
• Is this property cash-flow positive from Year 1?
• What is my projected cash-on-cash return and equity ROI over 10 years?
• How does the deal perform under optimistic vs. conservative assumptions?
• What is the Debt Service Coverage Ratio (DSCR) and will lenders view this favorably?
• How much cumulative wealth does this property generate through cash flow and appreciation?
The template is organized across five tabs: Instructions, Dashboard, Assumptions, P&L Forecast, and Property Value & Profitability. Each tab serves a distinct purpose while remaining fully integrated through cross-sheet references.
$ 40 -
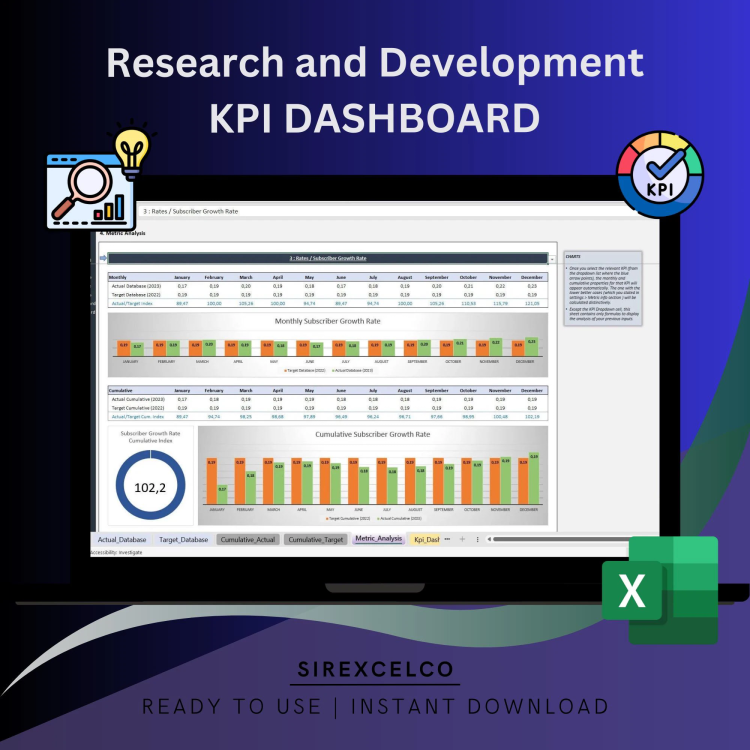
Research and Development KPI Dashboard Excel Template, KPI Report Template, Dynamic Reporting Dashboard Sheet, Performance Tracking Report
📊 **Research and Development KPI Dashboard | Excel KPI Report Template | Dynamic Reporting Dashboard | Performance Tracking Report**
For more details about the template, check the link below;
✨Introducing an innovative approach to decipher your research and development metrics within one elegant and comprehensive excel dashboard. Designed for meticulous researchers and dynamic industry professionals, this Dashboard Planner provides an expert-level data analysis at your fingertips.
🔍 **Distinct Features**:
💠 User-friendly interface: Navigate through your multiple streams of data with ease and make sense of your metrics in the most time-saving and seamless manner possible.
📈 Advanced Visualization: This Dynamic Dashboard employs sophisticated formulas to churn out tabulated data into visually appealing and easy-to-understand graphical representations.
✏️ Fully Customizable: Every cell, chart, and feature is customizable according to your specific need, making it a perfect fit for your unique research & development scenario.
⚙️ Automatic Calculation: Your productivity is our priority. This Excel Template will perform automatic calculations to save you from countless hours of manual entry.
🔧 Regularly Updated: To ensure you get the best of industry standards, our template is updated frequently to keep you ahead of your competition.
🌐 Multi-Industry Use: Whether you’re in Pharmaceuticals, Manufacturing, or IT, our template is designed to cover a broad range of industries.
📁 **Specifications**:
🖥️ Software Requirement: Microsoft Excel (Windows) or Numbers (Mac)
🗂️ Format: .xlsx File
⏬ Instant Digital Download: Yes
👥 This Dashboard Planner is perfect for all data enthusiasts, research analysts, industry professionals, and productivity-minded individuals who like to stay on top of their game.
🙏 Thank you for checking out my shop! If you have any questions, don’t hesitate to message me. Happy tracking! 🚀
$ 35 -
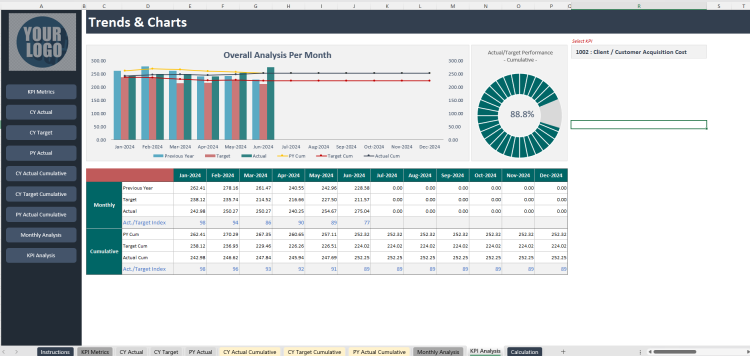
Research and Development KPI Excel Template
This template was built with real users in mind—designed to save time, reduce manual work, and give you the insight you need to improve performance. Whether for internal tracking or client reporting, it brings structure and professionalism to your data.
$ 39 -
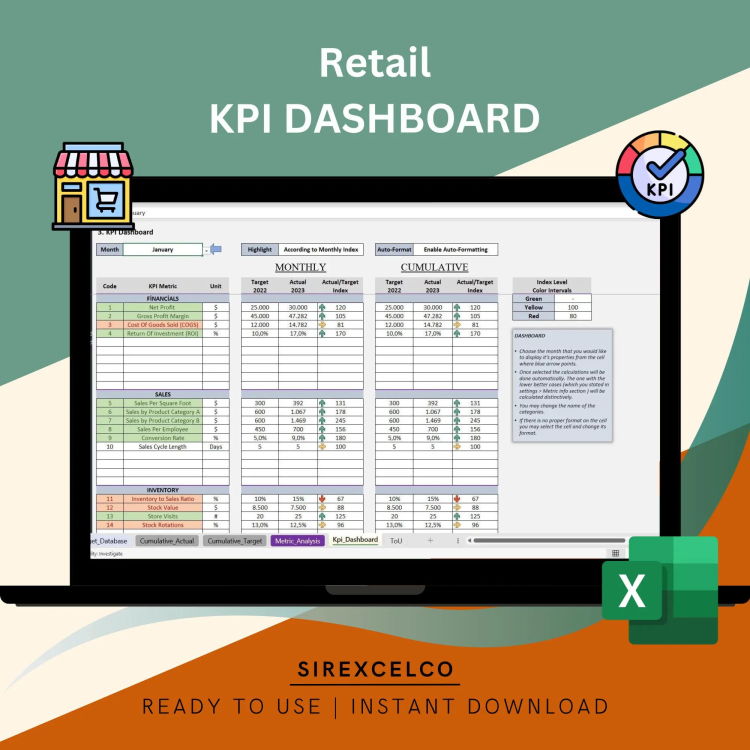
Retail KPI Dashboard Excel Template | Dynamic Monthly & Cumulative Metrics Tracker | Target vs Actual Performance Analysis
Track and analyze your retail business performance with our Retail KPI Dashboard Excel Template!
For more details about the template, check the link below;
This dynamic, easy-to-use template helps you monitor key retail metrics month by month and cumulatively, providing a clear comparison of target metrics versus actual performance. Whether you’re tracking sales, inventory, or customer engagement, this template features dynamic charts that adjust based on the selected metric, giving you real-time insights to make data-driven decisions. Ideal for retail managers and business owners looking to optimize their operational efficiency and performance.
Best for:
• Retail industry
• E-commerce
• Everyone starting with a new project
Content:
• Excel file compatible with Excel 2010 and higher (and with sample data)
• Professional Design
• Works both on Mac and Windows
• No installation needed. Ready to use
• Dashboard with charts
• Retail Kpi Dashboard Template
• Easy to use
• 100% editable
• Excel file
• Instant download
• Friendly customer support for all your questions
License: Private Use (not for distribution or resale)
$ 35 -
Retail KPI Excel Template
This template was built with real users in mind—designed to save time, reduce manual work, and give you the insight you need to improve performance. Whether for internal tracking or client reporting, it brings structure and professionalism to your data.
$ 39 -

Risk Management KPI Dashboard Excel Template, Excel Risk Metrics Report Template Digital File, Risk Assessment Dynamic Reporting Tracker
Risk Management KPI Dashboard
Introducing our cutting-edge “Risk Management KPI Dashboard | Excel Risk Metrics Report Template | Dynamic Analytics Tool | Decision-Making Companion.” This meticulously crafted, dynamic reporting tool is poised to revolutionize the way you navigate and optimize your risk management processes.
For more details about the template, check the link below;
Crafted with precision using Microsoft Excel and Google Sheets, this digital download transcends the boundaries of a typical spreadsheet – it’s your strategic ally in decision-making.
✨Instant Download: No waiting required. Access your dashboard immediately after purchase.
📊Excel Dashboard: Effortlessly view and manage a wealth of data for comprehensive risk analysis.
📉Risk Management KPI: Track multiple key performance indicators in a centralized location for maximum efficiency.
📝Metrics Report Template: Streamline the creation of detailed reports, allowing you to focus on strategic planning.
🎯Dynamic Analytics Tool: Monitor progress, identify trends, and achieve your risk management objectives with ease.
📑Excel Template: Top-notch design for user-friendly experience, adaptability, and accuracy.
Product Specifications:
💽File Type: XLSX
📈Form/Template: Excel Spreadsheet, Excel Sheet
✅Requirement: Microsoft Excel
💻Compatibility: Google Sheets
🏷️Function: Printable, Decision Making Tool, Data Organizer, Analytics Tool
🌐Access: Fully accessible and easy to use.
Craftsmanship: This isn’t just an Excel sheet; it’s a robust planning tool with meticulous attention to detail. Every element is carefully designed to ensure your success. The tool is easily customizable to suit your exact needs and built to evolve with your risk management strategies.
Digital Materials: Spreadsheet, Microsoft Excel, Excel Spreadsheet, Excel Sheet, Printable, Decision Making Tool, Analytics Tool, Google Sheets, Easy to Use, XLSX, Excel.
Thank you for choosing our product. Your success is a testament to our commitment to creating impactful tools. We appreciate your choice and honor the craftsmanship that goes into developing our products.
Make sure to explore other innovative products in our shop – each meticulously designed to support and enhance your projects. Take your time, and you’ll discover numerous tools to assist, inspire, and elevate your risk management endeavors. Wishing you abundant success!
$ 35 -
Rock-Climbing Gym Excel Financial Model
The Financial Analysts at Oak Business Consultant have made this complete and dynamic Rock-Climbing Gym Excel Financial Model Template for your financial planning needs. The model has a 5-year financial projection plan to track steady growth and profitability. It can also estimate ongoing operating expenses, monthly sales revenue, and startup investment requirements. With this easy-to-use template, there is no further need for complex calculation, you need to add numbers, and you are all set.
$ 195$ 350Rock-Climbing Gym Excel Financial Model
$ 195$ 350 -

Roulette Excel Tracker Template | Analyze Bets and Winning Patterns | Sector Color Dozen Column Even Odd Breakdown Stats | Win in Roulette
Take your roulette strategy to the next level with this dynamic Roulette Analyzer Excel Template!
Perfect for both casual and serious players, this template allows you to input your spin results and instantly receive detailed statistics. Analyze sector breakdowns, color ratios, column and dozen performance, even/odd splits, 1-19/19-36 segments, and track hot and cold numbers with ease. The charts are fully dynamic, providing a visual representation of your roulette performance in real-time. This template is easy to use, highly customizable, and designed to give you an edge by understanding your betting history and spin trends better than ever before.
For more details about the template, check the link below;
Key Features:
Dynamic sector, color, even/odd, and number breakdowns
Tracks 1-18 and 19-36 outcomes, dozens, and columns
Highlights most frequent and least frequent numbers
Automatic chart generation for visual analysis
Easy to use – just input your spin results!
Fully editable Excel file with real-time updates
Download your Roulette Metrics Tracker now and start mastering your strategy!
Content:
• Excel file compatible with Excel 2010 and higher (and with sample data)
• Professional Design
• Works both on Mac and Windows
• No installation needed. Ready to use
• Dashboard with charts
• Roulette Tracker Spreadsheet
• Easy to use
• 100% editable
• Excel file
• Instant download
• Friendly customer support for all your questions
License: Private Use (not for distribution or resale)
$ 22 -
SaaS KPI Excel Template
This template was built with real users in mind—designed to save time, reduce manual work, and give you the insight you need to improve performance. Whether for internal tracking or client reporting, it brings structure and professionalism to your data.
$ 39 -
Sales KPI Excel Template
This template was built with real users in mind—designed to save time, reduce manual work, and give you the insight you need to improve performance. Whether for internal tracking or client reporting, it brings structure and professionalism to your data.
$ 39 -

Sales KPI Excel Template | KPI Dashbord Report Template | KPI Report Analysis | Sales Performance Tracking Report | Digital Download
Sales KPI Excel Template
A Sales KPI or metric is a performance measurement that is used by sales teams and by the top management to track the effectiveness of relevant sales activities within a company. These measures help in optimizing your sales performance, sales funnel and sales cycle length.
For more details about the template, check the link below;
Best for:
• Sales KPI Dashboard for all types of companies
• Everyone opening a business
• Sales Professionals
• Everyone starting with a new project
• Sales Managers
This tool will help you analyze your Monthly Kpi Metric data.
After you insert your Monthly Numeric data for the KPI Metrics you determine, you can see a clear monthly and cumulative analysis for the metrics you determine. It is also possible to compare your numeric data with your target data and past year data.
Seeing the level of difference of these metrics will help you identify the problem and how to improve your model more effectively and efficiently.
Content:
• Excel file compatible with Excel 2010 and higher (and with sample data)
• Professional Design
• Works both on Mac and Windows
• No installation needed. Ready to use
• Dashboard with charts
• Sales Kpi Dashboard Excel Template
• Easy to use
• 100% editable
• Excel file
• Instant download
• Friendly customer support for all your questions
License: Private Use (not for distribution or resale)
$ 35 -
Sandwich Bar Excel Financial Model Template
At Oak business Consultants, we are experienced in making Financial model templates for start-ups or organizations that want to expand their business. This Excel Financial Model Template, dynamic yet flexible, enables you to understand your cash flow. The template includes 60- a monthly detailed Income Statement, Balance sheet, and Cash flow statement along with all performance KPIs and investors-related valuation charts, which are presented in both figures and graphs to give an owner a complete depiction of ongoing and future financial insights. In addition, the model will guide you in calculating initial start-up costs and making a five-year economic forecast.
$ 95$ 185


