

Ratio Analysis: A Complete Guide to Measuring Financial Health
Understanding a company’s numbers is one thing. Turning those numbers into insight is another. This is where ratio analysis becomes essential. Ratio analysis breaks down figures from the balance sheet, income statement, and cash flow statement. It helps leaders see the real picture of a business’s financial health and performance.
Why Ratio Analysis Matters
Ratios make financial statements meaningful. They allow you to:
- Compare performance across time
- Benchmark against competitors
- Spot strengths, weaknesses, and risks early
When done right, ratio analysis becomes more than an accounting tool—it’s a strategic guide for decision-making, investment, and growth.
Liquidity Ratios: Can You Pay the Bills?
Liquidity ratios measure how well a company can handle its short-term obligations.
- Current Ratio (Working Capital Ratio):
Current Assets ÷ Current Liabilities.
A figure above 1 shows the business has more assets than debts due soon.
- Quick Ratio (Acid-Test Ratio):
(Current Assets – Inventory) ÷ Current Liabilities.
This removes inventory to focus only on liquid assets like cash, accounts receivable, and short-term investments.
- Cash Ratio:
Cash ÷ Current Liabilities.
This is the most conservative measure of liquidity. It shows how well a business can pay debts using only cash.
Strong liquidity ratios give confidence to lenders, suppliers, and investors. Weak ratios often signal risk, even if profitability looks good.
Profitability Ratios: Are You Making Money?
These ratios reveal how efficiently a company turns revenue into profit.
- Gross Profit Margin and Gross Margin Ratio show how much profit remains after covering direct costs.
- Net Profit Margin reflects overall profitability after all expenses.
- Return on Equity (ROE) measures how effectively a business generates income from shareholders’ equity.
- Earnings Per Share (EPS) shows how much profit is attributable to each share of stock.
A strong profitability ratio set proves that the company is not just surviving but creating value.
Efficiency Ratios: How Well Are Assets Being Used?
Efficiency or activity ratios focus on how well resources are used.
- Inventory Turnover and Inventory Turnover Ratio highlight how often stock is sold and replaced.
- Asset Turnover Ratio measures how well assets are used to generate sales.
- Working Capital Ratio and Working Capital Turnover track how sales are generated relative to working capital.
- Accounts Receivable Turnover or Average Days Receivable measure how quickly customers pay.
Low efficiency ratios can signal wasted resources, poor management, or cash flow pressure.
Solvency Ratios: Can You Handle Long-Term Debt?
These leverage ratios examine how much a company relies on debt and whether it can manage it.
- Debt-to-Equity Ratio compares borrowed funds to owners’ capital.
- Debt Ratio or Debt-to-Asset Ratio shows the share of assets financed by debt.
- Interest Coverage Ratio demonstrates how easily earnings can cover interest payments.
- Coverage Ratios overall highlight financial stability when obligations mount.
Healthy solvency ratios assure investors that a company can survive downturns and still meet its commitments.
Market Ratios: How Do Investors See You?
Market-based ratios link financial performance with investor perception.
- Price-to-Earnings (P/E) Ratio, also known as Price/Earnings Ratio, reflects how much investors are willing to pay per dollar of earnings.
- Dividend Yield shows income return relative to stock price.
- Market Prospect Ratios overall evaluate growth expectations and shareholder value.
These metrics matter most for listed companies, but even private firms use them during business valuation exercises.
Bringing It Together: Strategic Financial Analysis
No single ratio tells the full story. The power comes when you combine them:
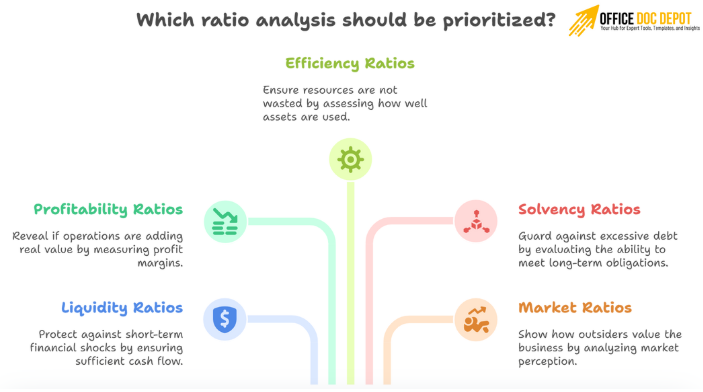
- Liquidity ratios protect you from short-term shocks.
- Profitability ratios reveal whether operations add real value.
- Efficiency ratios ensure resources are not being wasted.
- Solvency ratios guard against excessive debt.
- Market ratios show how outsiders value the business.
Together, they form the foundation of financial ratio analysis. Used wisely, they help executives, consultants, and investors understand an organization’s financial condition, compare performance, and make better strategic decisions.
Frequently Asked Questions
What is ratio analysis and why is it important?
Ratio analysis examines relationships between key figures in financial statements. It turns numbers into insights. It helps management assess profitability, liquidity, efficiency, solvency, and market value to guide decisions.
How does ratio analysis support decision-making?
It identifies trends and risks. It allows benchmarking against competitors and industry standards. This helps make informed operational, investment, and growth decisions.
Which ratios indicate short-term financial health?Liquidity ratios, like the current ratio, quick ratio, and cash ratio, measure a company’s ability to meet short-term obligations. Strong liquidity reduces financial risk.
What do profitability ratios show?
Profitability ratios show how well a business converts revenue into profit. They reflect operational efficiency and value creation for shareholders.
Conclusion
Ratios are not just numbers. They are signals—early warnings, green lights, and sometimes red flags. When paired with trend analysis and industry benchmarks, ratio analysis becomes one of the most reliable tools for improving operational efficiency, measuring financial performance, and guiding long-term strategy.
-

Vineyard Development – 10 Year Financial Model
Dynamic and investor-focused 10-year financial model, designed to evaluate the financial feasibility and long-term profitability of a vineyard.
$ 129 -

Wine Production Facility (Winery) – 10 Year Financial Model
Dynamic and investor-focused 10-year financial model, designed to evaluate the financial feasibility and long-term profitability of a Wine Production Facility (Winery) project.
$ 149 -

Golf Course Financial Model
These Excel-based models provide a comprehensive 5-year financial forecast for golf courses, available in two specialized versions: one for public/daily-fee courses and another for membership-based operations. Both models include detailed revenue calculations, comprehensive expense modeling, 3-statement financial reports, IRR analysis, cap table management, and exit valuation.
$ 230 -

End-to-End Space Company Financial Model
This comprehensive financial model is designed for space startups, offering up to 10 years of detailed forecasting. It covers launch services, satellite manufacturing, constellation services, fixed costs, cap tables, loans, and more. With customizable assumptions, dynamic revenue projections, and in-depth financial statements (income statement, balance sheet, cash flow), this model helps plan and manage complex space startup operations. It also includes features like discounted cash flow analysis, investor IRR calculations, and visual insights. Ideal for space startups or satellite companies looking for a detailed and flexible financial planning tool.
$ 75 -

Educational Courses Financial Model
This Excel model forecasts the financial performance of an educational course business over 10 years. It includes detailed course scheduling, revenue projections, expense modeling, 3-statement financial reports, and investor analysis.
$ 75 -

Equipment Rental Financial Model
This upgraded Excel model forecasts the financial performance of an equipment rental business over 10 years. It includes detailed purchase schedules, depreciation logic, 3-statement financial reporting, cap table management, and exit valuation.
$ 75 -

Hair Salon Financial Model
This Excel-based model forecasts the financial performance of a hair salon or barber shop over 10 years. It includes detailed revenue calculations based on haircuts, add-on services, and products, along with comprehensive expense modeling. It generates 3-statement financial reports, IRR analysis, and allows for financing scenarios and exit valuation.
$ 75 -

Franchisor Licensing Financial Model
This Excel-based model forecasts the financial performance of a franchisor over 10 years. It includes detailed revenue calculations based on franchise fees, royalties, and ad fees, comprehensive expense modeling, 3-statement financial reports, IRR analysis, cap table management, and exit valuation.
$ 75 -

Franchise Scaling Financial Model
This Excel-based model forecasts the financial performance of scaling a franchise business with up to 12 locations over 10 years. It includes detailed development costs, franchise fees, revenue projections, debt financing, and cash flow analysis.
$ 45 -

Fitness Studio Franchise Financial Model
This advanced Excel model forecasts the financial performance of scaling a studio franchise (e.g., fitness) over 15 years. It features detailed capex and debt logic, 3-statement financial reporting, investor summaries, and dynamic scaling assumptions.
$ 45 -

Flat Fee Lending Financial Model
This Excel-based model forecasts the financial performance of a flat fee lending business over 10 years. It includes detailed loan origination and repayment calculations, comprehensive expense modeling, 3-statement financial reports, IRR analysis, cap table management, and exit valuation.
$ 75 -

Lending Financial Model with Upfront Equity
This comprehensive Excel model forecasts the financial performance of a lending business over 10 years. It includes detailed loan configuration for interest-only and principal-and-interest loans, tracks loan disbursements and repayments, calculates origination fees and interest revenue, and generates robust financial statements, including balance sheets.
$ 75