-

Energy Management KPI Dashboard Excel Template | Track & Analyze Energy Metrics | Monthly Cumulative Energy Performance Dashboard
Optimize your energy management with this Energy Management KPI Dashboard Excel Template.
For more details about the template, check the link below;
This powerful tool is designed for energy professionals and businesses looking to measure, compare, and analyze energy management KPIs month by month and cumulatively. Easily track your energy metrics, compare actual performance with target goals, and visualize data with dynamic charts that adjust based on your selected metrics. This Excel template is simple, intuitive, and easy to use, helping you make informed decisions that drive energy efficiency and cost savings.
Best for:
• Energy Suppliers
• Energy Industry
• Everyone starting with an energy new project
Content:
• Excel file compatible with Excel 2010 and higher (and with sample data)
• Professional Design
• Works both on Mac and Windows
• No installation needed. Ready to use
• Dashboard with charts
• Energy KPI Dashboard Template
• Easy to use
• 100% editable
• Excel file
• Instant download
• Friendly customer support for all your questions
License: Private Use (not for distribution or resale)
$ 35 -

Finance KPI Dashboard Excel Template | Track & Analyze Financial Metrics | Monthly Cumulative Reports | Dynamic Charts | Easy to Use
Optimize your financial performance tracking with the Finance KPI Dashboard Excel Template.
For more details about the template, check the link below;
This easy-to-use template allows you to measure, compare, and analyze finance KPIs month by month, alongside cumulative data analysis. With dynamic charts that adjust based on your selected metric, you can effortlessly visualize and track financial goals, comparing actual performance against target metrics. Whether you’re focused on budgeting, profitability, or cost control, this dashboard provides actionable insights into your financial health. Ideal for finance professionals, startups, and businesses looking to streamline their financial reporting.
Regardless of the size, age, and industry, each and every company needs to be conscious of their financial performance. While accountants deal with all the expenses, income and budgets, the company’s leadership also needs to be informed about important financial measures.
After you insert your Monthly Numeric data for the KPI Metrics you determine, you can see a clear monthly and cumulative analysis for the metrics you determine. It is also possible to compare your numeric data with your target data and past year data.
The fastest and most efficient way to keep track of an organization’s business performance is to set up a KPI dashboard that displays financial metrics.
Best for:
• All types of companies
• Everyone opening a business
• Finance & accounting professionals
• Everyone starting with a new project
• Start-ups
Content:
• Excel file compatible with Excel 2010 and higher (and with sample data)
• Professional Design
• Works both on Mac and Windows
• No installation needed. Ready to use
• Dashboard with charts
• Finance KPI Dashboard Template
• Easy to use
• 100% editable
• Excel file
• Instant download
• Friendly customer support for all your questions
License: Private Use (not for distribution or resale)
$ 35 -
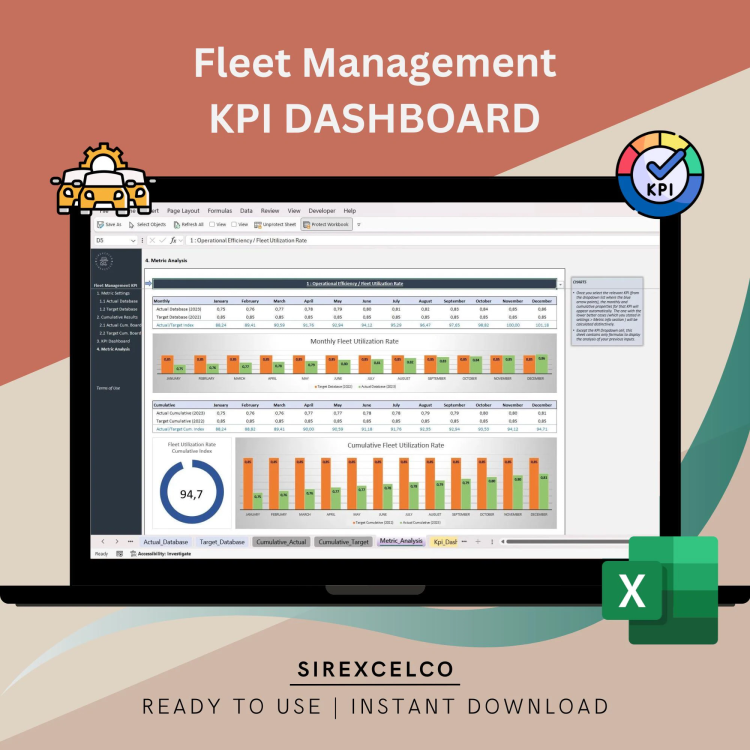
Fleet Management KPI Dashboard Excel Template, KPI Report, Dynamic Editable Performance Tracking Tool, Reporting File, Ready to Download
Keep your fleet operations running smoothly with this dynamic and editable Fleet Management KPI Dashboard Excel Template.
For more details about the template, check the link below;
Designed for fleet managers and logistics teams, this easy-to-use tool allows you to track key metrics like fuel efficiency, maintenance costs, vehicle utilization, and more—all in one place.
Fully customizable, you can tailor this dashboard to fit your unique fleet needs, helping you stay organized and make data-driven decisions to optimize performance. Whether you’re managing a small or large fleet, this template simplifies your reporting and keeps all your KPIs in clear view.
Perfect for fleet managers, logistics coordinators, and business owners who want an efficient way to monitor their fleet’s performance.
Key Features:
Fully editable and customizable Excel dashboard
Track essential fleet KPIs like fuel costs, maintenance, and utilization
Simple design for easy use, even without advanced Excel skills
Ready to download and start using immediately
Ideal for fleet managers, logistics teams, and operations departments
Content:
• Excel file compatible with Excel 2010 and higher (and with sample data)
• Professional Design
• Works both on Mac and Windows
• No installation needed. Ready to use
• Dashboard with charts
• Fleet Management KPI Dashboard Template
• Easy to use
• 100% editable
• Excel file
• Instant download
• Friendly customer support for all your questions
$ 35 -

FMCG KPI Report Excel Template | Dynamic Monthly & Cumulative Metrics Tracker | Target vs Actual Performance Analysis
Optimize your fast-moving consumer goods (FMCG) business with our FMCG KPI Report Excel Template!
For more details about the template, check the link below;
This dynamic, easy-to-use tool allows you to track essential metrics month by month and cumulatively, helping you compare target KPIs with actual performance. The template includes real-time dynamic charts that adjust based on the metrics selected, providing quick insights into your FMCG performance. Designed for managers and business owners, this template simplifies performance tracking, ensuring you stay ahead in the competitive FMCG sector.
Content:
• Excel file compatible with Excel 2010 and higher (and with sample data)
• Professional Design
• Works both on Mac and Windows
• No installation needed. Ready to use
• Dashboard with charts
• FMCG KPI Dashboard Template
• Easy to use
• 100% editable
• Excel file
• Instant download
• Friendly customer support for all your questions
License: Private Use (not for distribution or resale)
$ 35 -
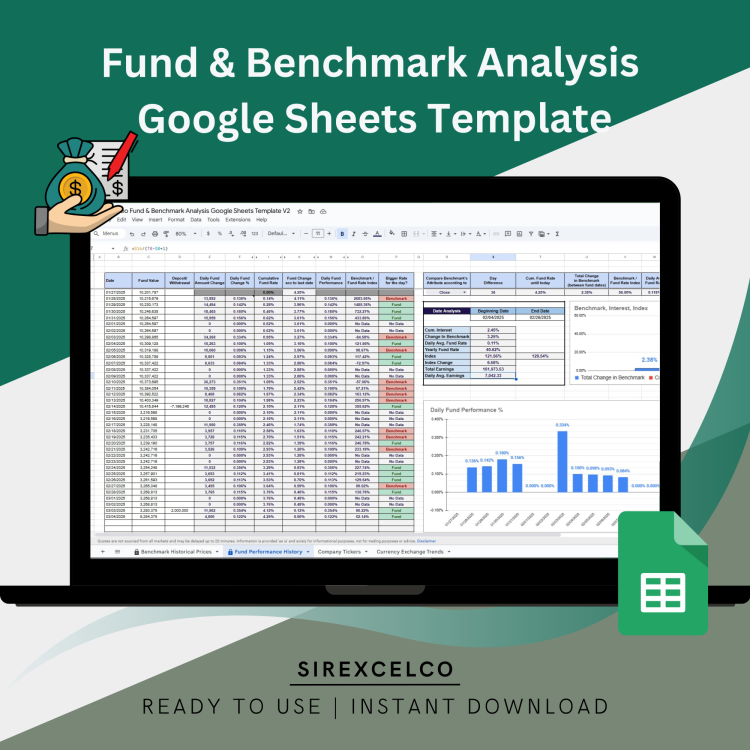
Fund & Benchmark Analysis Google Sheets Template | Investment Analytics | Performance Tracking | Compare Funds with Custom Benchmarks
Easily track your investment performance with this Google Sheets Fund Performance Tracker.
For more details about the template, check the link below;
This dynamic and easy-to-use template helps investors analyze their fund’s daily performance while comparing it to a custom benchmark—whether it’s a currency, stock, or mutual fund. Get insights on Cumulative Interest, Benchmark Changes, Daily & Yearly Fund Rates, Total Earnings, and more. Simply enter your data, and the template automatically generates key analytics and comparisons. Perfect for investors looking for a structured and insightful way to monitor and optimize their portfolio performance.
$ 40 -

General Management KPI Dashboard | Excel KPI Report Template | Dynamic Reporting Dashboard | Performance Tracking Report
Introducing our Excel Template General Management KPI Dashboard!
For more details about the template, check the link below;
In the fast-paced world of business, effective management is essential for success. Our General Management KPI Dashboard Excel template is designed to provide managers, executives, and professionals with a comprehensive tool to track and analyze key performance indicators, empowering them to make data-driven decisions and drive business growth.
Why choose our General Management KPI Dashboard?
Enhanced Decision-making: Our template offers a centralized platform for monitoring and analyzing crucial business metrics. By consolidating key performance indicators in one place, our dashboard provides a clear and concise overview of your organization’s performance. Make informed decisions, identify trends, and take proactive measures to optimize your business operations.
Wide Range of Metrics: Our template covers a diverse set of KPIs relevant to general management. From financial indicators such as revenue, profit margins, and cash flow to operational metrics like employee productivity, customer satisfaction, and project success rates, our dashboard equips you with a holistic view of your organization’s performance.
Customizable and User-friendly: We understand that each business has unique needs and requirements. Our template is fully customizable, allowing you to tailor it to your specific objectives. Add or remove KPIs, adjust timeframes, and personalize visualizations to match your preferences. With an intuitive interface, our dashboard is easy to navigate, even for those without advanced Excel skills.
Time and Resource Efficiency: Automate data collection and analysis with our General Management KPI Dashboard, saving you valuable time and resources. No more manual data entry or complex calculations. With just a few clicks, you can access real-time insights and trends, empowering you to respond swiftly to challenges and seize opportunities.
Who can benefit from our General Management KPI Dashboard?
• Business executives: Gain a comprehensive overview of your company’s performance, identify areas for improvement, and make strategic decisions to drive growth.
• Department managers: Track team productivity, project success rates, and customer satisfaction to optimize operational efficiency and performance.
• Entrepreneurs: Monitor financial metrics, cash flow, and sales performance to assess the health and growth potential of your business.
• Business analysts: Extract valuable insights from data trends and make data-driven recommendations to enhance business processes.
Invest in our General Management KPI Dashboard Excel template and unlock the power of data-driven decision-making in your organization. Streamline your management practices, drive performance, and achieve your business objectives. Get started today!
Content:
• Excel file compatible with Excel 2010 and higher (and with sample data)
• Professional Design
• Works both on Mac and Windows
• No installation needed. Ready to use
• Dashboard with charts
• General Management KPI Dashboard Template
• Easy to use
• 100% editable
• Excel file
• Instant download
• Friendly customer support for all your questions
License: Private Use (not for distribution or resale)
$ 35 -
GMP, Good Manufacturing Practices Training PPT
The provided document, “OpEx – GMP Modules All in One.pdf” by Vishnu Rayapeddi, serves as a comprehensive training manual on Good Manufacturing Practices (GMP). It systematically covers the fundamentals of GMP, defining its purpose as ensuring products are consistently manufactured to a quality appropriate for their intended use, ultimately leading to customer satisfaction. The manual meticulously details how GMP applies to people (training, health, hygiene, attitude), buildings (space, light, planned flow, environmental controls, maintenance), and systems (identification, double-checking, documentation). Furthermore, it elaborates on critical aspects like labelling, weighing, personal hygiene, and cleaning processes, emphasising the prevention of mix-ups, contamination, and product performance issues. Finally, the text explains how compliance is measured through internal and external audits, process control, customer complaints, and adherence to specifications and yield calculations, underlining the legal, corporate, and moral imperatives for following GMP.
$ 59$ 69 -
Guide to using the Microsoft (MS) Teams FREE Planner App for tracking Waterfall, PRINCE2, Agile and Agile Scrum projects
Step-by-step MS Teams Planner guide for managing Waterfall, PRINCE2 & Agile projects. Learn to set up boards, track tasks & report progress easily.
 $ 30
$ 30$ 40 -

Healthcare KPI Dashboard Excel Template, KPI Report, Dynamic Reporting File, Performance Tracking Report
Healthcare KPI Dashboard
Introducing our “Healthcare KPI Dashboard & Excel KPI Report Template”, the ultimate tool crafted for healthcare professionals seeking effortless dynamic reporting and performance tracking. This innovative tool is not just your average ‘dashboard decor’; it’s a vital assistant that turns your daily data into a seamless dashboard planner.
For more details about the template, check the link below;
📊 SPREADSHEET: A meticulously designed Excel spreadsheet, perfect for crunching numbers, visualizing data, and generating insightful reports.
💼 MICROSOFT EXCEL: Built explicitly for the platform you know and trust. Harness the power of Excel and simplify your complex data interpretation.
🎯 EXCEL SPREADSHEET: A health-specific KPI Excel template with a focus on metrics crucial for performance measurement.
🗂 EXCEL SHEET: Simplify your data organization. Use our Excel sheet as your ride-or-die for data management, be it for patient health tracking, personnel management, or financial planning.
🖨 PRINTABLE: Want to share your findings out of the digital world? Our product comes with easy-to-print options.
🔑 DECISION MAKING TOOL: Transform complex data into actionable insights. Our dashboard helps you make informed decisions, fast and efficient.
👑 DECISION MAKER: This tool gives you the power to make the tough decisions via its intelligent design and high usability.
🧹 ORGANIZING TOOL: Say goodbye to cluttered information and hello to organized, easy-to-understand data.
🌐 GOOGLE SHEETS: For Google lovers, the dashboard is entirely compatible, bringing the same efficiency and clarity.
📂 DIGITAL DOWNLOAD: Instant access post-purchase, no waiting, no shipping fees. Get started right away!
🎯 EASY TO USE: We’ve designed this with you in mind. Its user-friendly interface makes it a breeze to use, even for the non-tech savvy.
📁 XLSX: Offering seamless compatibility with your favourite software, be it MS Excel, Google Sheets or other compatible programs.
Experience the ease and efficiency of our Healthcare KPI Dashboard today. Collect, analyze, and achieve all in one go! Thank you for stopping by. Looking forward to elevating your reporting process with our dashboard.
Please don’t hesitate to reach out if you have any questions, we are always here to help! Enjoy shopping and have a fantastic day!
As healthcare professionals, we understand the importance of data-driven decision-making in providing the best patient care and optimizing healthcare operations. Our Healthcare KPI Dashboard Excel template is designed to empower healthcare practitioners, administrators, and analysts with the tools they need to track and analyze key performance indicators effectively.
Why choose our Healthcare KPI Dashboard?
Streamlined Data Analysis: Our template provides a user-friendly interface that simplifies the process of collecting and analyzing crucial healthcare metrics. No more sifting through stacks of papers or struggling with complex spreadsheets. Our dashboard consolidates all the essential KPIs in one place, allowing you to focus on what matters most – improving patient outcomes.
Comprehensive Metrics: Our template covers a wide range of healthcare KPIs, ensuring you have a holistic view of your organization’s performance. From patient satisfaction and readmission rates to average length of stay and revenue per procedure, our dashboard provides insights into every aspect of your healthcare operations.
Customizable and Easy to Use: We understand that every healthcare organization is unique, and that’s why our template is fully customizable. Tailor it to your specific needs by adding or removing KPIs, adjusting timeframes, and customizing visualizations. Even if you’re not an Excel expert, our intuitive design makes it easy to navigate and update your data effortlessly.
Time and Cost Savings: By automating data collection and analysis, our Healthcare KPI Dashboard saves you valuable time and resources. Say goodbye to manual data entry and complex calculations. With just a few clicks, you’ll have real-time insights into your healthcare performance, allowing you to make informed decisions quickly.
Who can benefit from our Healthcare KPI Dashboard?
• Healthcare administrators: Track key metrics to optimize resource allocation, improve efficiency, and enhance patient experience.
• Hospital managers: Monitor patient flow, readmission rates, and revenue per procedure to identify areas for improvement.
• Medical practitioners: Analyze patient satisfaction and clinical outcomes to enhance the quality of care provided.
• Healthcare analysts: Extract actionable insights from data trends and identify opportunities for operational enhancements.
Content:
• Excel file compatible with Excel 2010 and higher (and with sample data)
• Professional Design
• Works both on Mac and Windows
• No installation needed. Ready to use
• Dashboard with charts
• Healthcare KPI Dashboard Template
• Easy to use
• 100% editable
• Excel file
• Instant download
• Friendly customer support for all your questions
License: Private Use (not for distribution or resale)
$ 35 -

HR Expense Control Excel Template
Human Resources Expenses spreadsheet is a vital tool for effectively managing departmental expenditures, covering essential areas.
$ 19