-
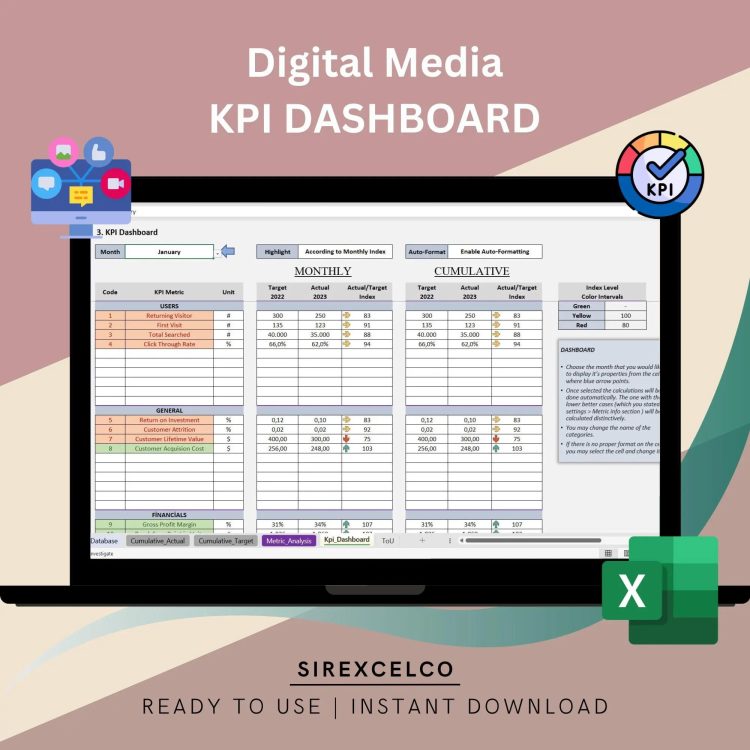
Digital Media KPI Report Excel Template | Track Monthly & Cumulative Metrics | Dynamic Charts and Performance Analysis
Track and optimize your digital media performance with this Digital Media KPI Report Excel Template!
For more details about the template, check the link below;
Whether you’re monitoring ad performance, engagement metrics, or overall digital media strategy, this template provides a clear, comprehensive view of your results. Compare your target metrics against actual performance, track progress month by month and cumulatively, and visualize your data with dynamic charts that automatically update based on your selected metric.
Ideal for digital marketers, content creators, and media managers, this template is incredibly easy to use—just enter your data, and the template takes care of the rest. No advanced Excel skills are needed, making it perfect for professionals looking to improve their digital media strategy with reliable, visual data analysis.
Key Features:
-Track digital media metrics on a monthly and cumulative basis
-Compare target vs actual performance
-Dynamic charts that adjust based on selected metrics
-Fully customizable and user-friendly
-Perfect for digital marketers, ad specialists, and content managers
-Requires no advanced Excel knowledge
-This template is an essential tool for anyone who wants to streamline their digital media performance tracking and make data-driven decisions with ease.
Material:
📝 Spreadsheet
🖥️ Microsoft Excel
📇 Excel Spreadsheet
📄 Excel Sheet
📑 Printable
🚦 Decision Making Tool
🔧 Decision Maker
🗂️ Organizing Tool
🌐 Google Sheets
⬇️ Digital Download
🎉 Easy to use
🎈 Ready to use
💹 KPI
Best for:
• Publishers
• Bloggers
• Everyone starting with a new project
Content:
• Excel file compatible with Excel 2010 and higher (and with sample data)
• Professional Design
• Works both on Mac and Windows
• No installation needed. Ready to use
• Dashboard with charts
• Digital Media KPI Dashboard Template
• Easy to use
• 100% editable
• Excel file
• Instant download
• Friendly customer support for all your questions
License: Private Use (not for distribution or resale)
$ 35 -

Social Media KPI Dashboard Excel Template | Track Social Media Metrics | Monthly & Cumulative Analysis | Dynamic Social Media Reports
Easily track and analyze your social media performance with this Social Media KPI Dashboard Excel Template.
For more details about the template, check the link below;
Ideal for marketers, influencers, and social media managers, this template helps you monitor your monthly and cumulative social media KPIs. Compare actual performance against target metrics, visualize data through dynamic charts, and gain insights to optimize your social media strategies. Whether you’re measuring engagement, growth, or content performance, this template makes managing your social media metrics simple and efficient.
Designed for marketers, influencers, and business owners, this template is incredibly user-friendly and requires no advanced Excel skills. Simply input your data, choose the metric you want to focus on, and the template will automatically generate charts to help you monitor your success.
Key Features:
Track social media metrics monthly and cumulatively
Compare target metrics vs actual performance
Dynamic charts that update based on selected metrics
User-friendly and fully customizable
Perfect for marketers, influencers, and social media managers
No advanced Excel knowledge needed
This template is an essential tool for anyone looking to improve their social media strategy and measure performance with accuracy.
Best for:
• Socal Media Experts
• Bloggers
• Everyone starting with a new project
• Marketing Experts
• Influencers
• Everyone opening a business
This tool will help you analyze your Monthly Kpi Metric data.
After you insert your Monthly Numeric data for the KPI Metrics you determine, you can see a clear monthly and cumulative analysis for the metrics you determine. It is also possible to compare your numeric data with your target data and past year data.
Seeing the level of difference of these metrics will help you identify the problem and how to improve your model more effectively and efficiently.
Content:
• Excel file compatible with Excel 2010 and higher (and with sample data)
• Professional Design
• Works both on Mac and Windows
• No installation needed. Ready to use
• Dashboard with charts
• Social Media KPI Dashboard Template
• Easy to use
• 100% editable
• Excel file
• Instant download
• Friendly customer support for all your questions
License: Private Use (not for distribution or resale)
Thanks for visiting!
$ 35 -

Marketing KPI Report Excel Template | Track Monthly & Cumulative Metrics | Dynamic Charts and Performance Analysis
Take control of your marketing performance with this Marketing KPI Report Excel Template!
For more details about the template, check the link below;
Whether you’re monitoring campaign success, lead generation, or engagement metrics, this template offers a powerful way to track your marketing metrics month by month and cumulatively. You can easily compare target vs actual results and visualize your progress through dynamic charts that automatically update based on the metric you select.
Perfect for marketers, business owners, and marketing professionals, this template requires no advanced Excel skills and is fully customizable to meet your needs. Simply input your data and watch the template do the heavy lifting, helping you make informed, data-driven decisions to improve your marketing efforts.
Key Features:
Track marketing metrics on a monthly and cumulative basis
Compare target vs actual performance
Dynamic charts that update with chosen metrics
User-friendly and easy to customize
Ideal for marketers, business owners, and marketing teams
No advanced Excel skills required
This template is an essential tool for anyone looking to streamline their marketing reporting and make data-backed decisions.
Content:
• Excel file compatible with Excel 2010 and higher (and with sample data)
• Professional Design
• Works both on Mac and Windows
• No installation needed. Ready to use
• Dashboard with charts
• Marketing Kpi Dashboard Excel Template
• Easy to use
• 100% editable
• Excel file
• Instant download
• Friendly customer support for all your questions
License: Private Use (not for distribution or resale)
$ 35 -

Project Management KPI Report Excel Template | Track Monthly and Cumulative Metrics | Dynamic Charts & Performance Analysis
Take control of your projects with the Project Management KPI Report Excel Template!
For more details about the template, check the link below;
This template makes it easy to monitor your project performance by tracking key metrics month by month and cumulatively. Whether you need to compare target metrics with actual results or visualize progress through dynamic charts, this tool simplifies the process for project managers, team leaders, and business professionals.
No advanced Excel skills are needed to use this fully customizable template. Simply input your project data, choose the metric you want to focus on, and the template will automatically generate reports and charts to keep your projects on track.
Key Features:
Track project management KPIs monthly and cumulatively
Compare target vs actual performance metrics
Dynamic charts that update automatically based on the selected metrics
User-friendly and fully customizable to your project needs
Ideal for project managers, team leads, and business professionals
No advanced Excel knowledge required
This template helps you make data-driven decisions and ensures that your projects are completed efficiently and on time.
Content:
• Excel file compatible with Excel 2010 and higher (and with sample data)
• Professional Design
• Works both on Mac and Windows
• No installation needed. Ready to use
• Dashboard with charts
• Project Management KPI Dashboard Template
• Easy to use
• 100% editable
• Excel file
• Instant download
• Friendly customer support for all your questions
License: Private Use (not for distribution or resale)
$ 35 -
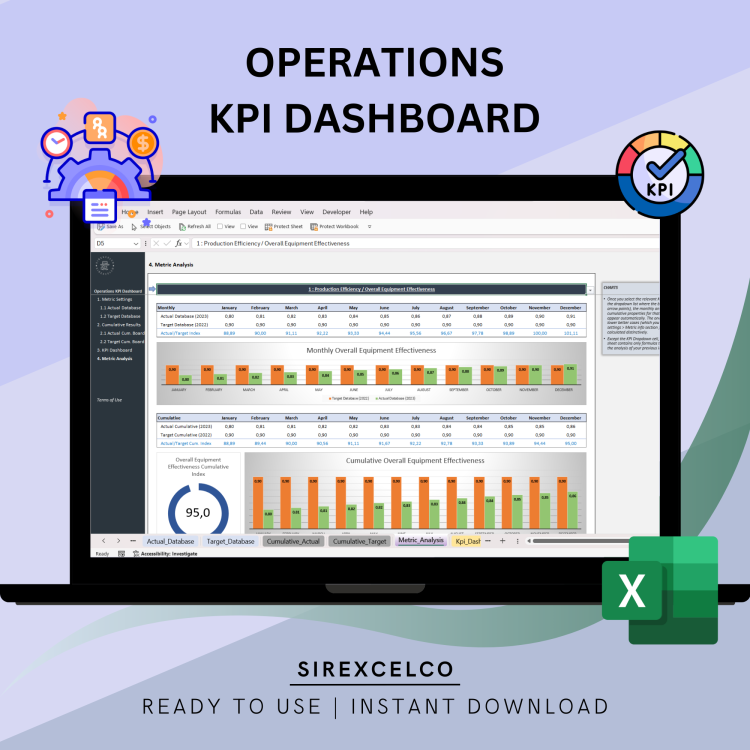
Operations KPI Dashboard Excel Template | Spreadsheet for Business Management | Performance Tracking | Editable Operations KPI Dashboard
This Operations KPI Dashboard Excel Template is perfect for tracking and visualizing your business performance metrics.
For more details about the template, check the link below;
Whether you’re managing a small business or a large enterprise, this customizable Excel dashboard helps you monitor key performance indicators (KPIs) in real-time. With easy-to-use formulas and pre-built charts, you can efficiently track and analyze data to make informed decisions. Download this template today and take control of your business analytics with a professional, user-friendly tool.
Content:
• Excel file compatible with Excel 2010 and higher (and with sample data)
• Professional Design
• Works both on Mac and Windows
• No installation needed. Ready to use
• Dashboard with charts
• Operations KPI Dashboard
• Easy to use
• 100% editable
• Excel file
• Instant download
• Friendly customer support for all your questions
License: Private Use (not for distribution or resale)
$ 35 -
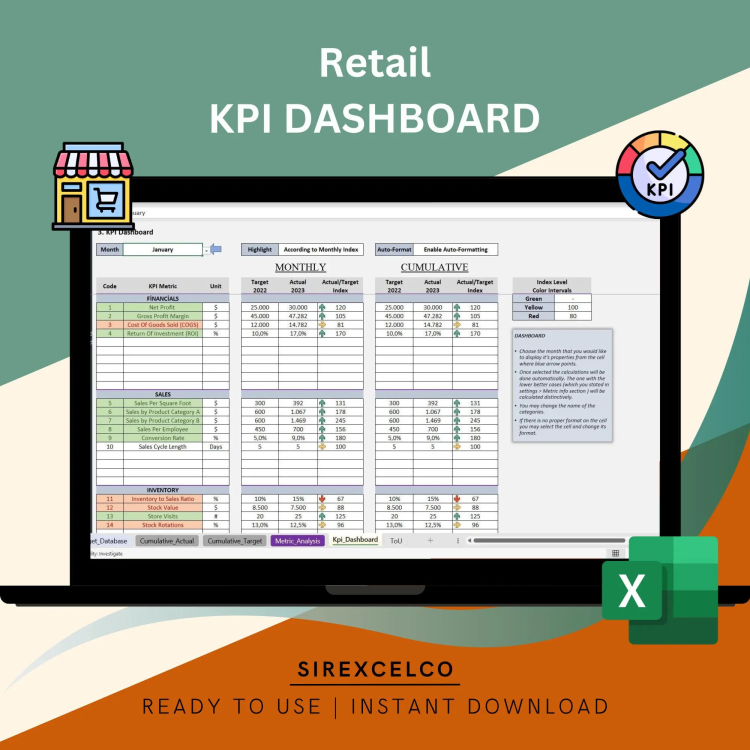
Retail KPI Dashboard Excel Template | Dynamic Monthly & Cumulative Metrics Tracker | Target vs Actual Performance Analysis
Track and analyze your retail business performance with our Retail KPI Dashboard Excel Template!
For more details about the template, check the link below;
This dynamic, easy-to-use template helps you monitor key retail metrics month by month and cumulatively, providing a clear comparison of target metrics versus actual performance. Whether you’re tracking sales, inventory, or customer engagement, this template features dynamic charts that adjust based on the selected metric, giving you real-time insights to make data-driven decisions. Ideal for retail managers and business owners looking to optimize their operational efficiency and performance.
Best for:
• Retail industry
• E-commerce
• Everyone starting with a new project
Content:
• Excel file compatible with Excel 2010 and higher (and with sample data)
• Professional Design
• Works both on Mac and Windows
• No installation needed. Ready to use
• Dashboard with charts
• Retail Kpi Dashboard Template
• Easy to use
• 100% editable
• Excel file
• Instant download
• Friendly customer support for all your questions
License: Private Use (not for distribution or resale)
$ 35 -
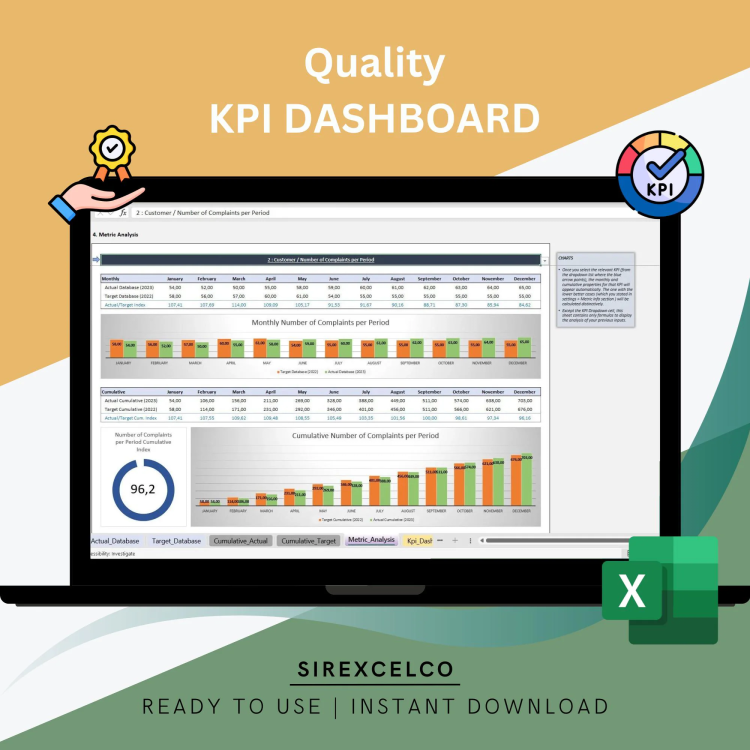
Quality KPI Dashboard Excel Template | Dynamic Monthly Cumulative Metrics Tracker | Target vs Actual Performance Analysis | Digital Download
✨Introducing our Quality KPI Dashboard, an expertly designed Excel KPI Report Template.
With our unique product, you can dynamically enhance your reporting process and effortlessly track the performance of your projects or business.
For more details about the template, check the link below;
🔑Unique Features and Benefits:
📊Complete KPI report template that allows an intuitive understanding of your data
🔄Interactive dashboard that provides a dynamic & comprehensive visual representation of your metrics
📈Equipped with the ability to track performance over various timelines and parameters for a detailed analysis
🎯Perfect tool for decision-making, aiding you to make grounded and informed choices
💡Constructed in Microsoft Excel, a familiar platform that ensures an easy-going experience
🖥️Specs and Materials:
💻Created in an Excel Spreadsheet, compatible with any version of MS Excel
🗂️Easily Printable to have your data at your fingertips during crucial meetings
📑Softcopy (Digital Download) format that allows usage across different devices
🌐Also compatible with Google Sheets and can be easily imported & exported between platforms
🔧Easy-to-use and understand without having any advanced Excel knowledge
✅Available in .xlsx, excel format
Improve your quality management processes with our Quality KPI Dashboard Excel Template! This dynamic and easy-to-use tool allows you to track essential quality metrics month by month and cumulatively. Compare your target metrics with actual performance and visualize your data with dynamic charts that adjust based on the selected metric. Perfect for quality managers, auditors, and business owners, this template helps streamline quality control efforts, providing valuable insights to drive continuous improvement and operational excellence.
Content:
• Excel file compatible with Excel 2010 and higher (and with sample data)
• Professional Design
• Works both on Mac and Windows
• No installation needed. Ready to use
• Dashboard with charts
• Quality KPI Dashboard Template
• Easy to use
• 100% editable
• Excel file
• Instant download
• Friendly customer support for all your questions
License: Private Use (not for distribution or resale)
$ 35 -

FMCG KPI Report Excel Template | Dynamic Monthly & Cumulative Metrics Tracker | Target vs Actual Performance Analysis
Optimize your fast-moving consumer goods (FMCG) business with our FMCG KPI Report Excel Template!
For more details about the template, check the link below;
This dynamic, easy-to-use tool allows you to track essential metrics month by month and cumulatively, helping you compare target KPIs with actual performance. The template includes real-time dynamic charts that adjust based on the metrics selected, providing quick insights into your FMCG performance. Designed for managers and business owners, this template simplifies performance tracking, ensuring you stay ahead in the competitive FMCG sector.
Content:
• Excel file compatible with Excel 2010 and higher (and with sample data)
• Professional Design
• Works both on Mac and Windows
• No installation needed. Ready to use
• Dashboard with charts
• FMCG KPI Dashboard Template
• Easy to use
• 100% editable
• Excel file
• Instant download
• Friendly customer support for all your questions
License: Private Use (not for distribution or resale)
$ 35 -

Healthcare KPI Dashboard Excel Template, KPI Report, Dynamic Reporting File, Performance Tracking Report
Healthcare KPI Dashboard
Introducing our “Healthcare KPI Dashboard & Excel KPI Report Template”, the ultimate tool crafted for healthcare professionals seeking effortless dynamic reporting and performance tracking. This innovative tool is not just your average ‘dashboard decor’; it’s a vital assistant that turns your daily data into a seamless dashboard planner.
For more details about the template, check the link below;
📊 SPREADSHEET: A meticulously designed Excel spreadsheet, perfect for crunching numbers, visualizing data, and generating insightful reports.
💼 MICROSOFT EXCEL: Built explicitly for the platform you know and trust. Harness the power of Excel and simplify your complex data interpretation.
🎯 EXCEL SPREADSHEET: A health-specific KPI Excel template with a focus on metrics crucial for performance measurement.
🗂 EXCEL SHEET: Simplify your data organization. Use our Excel sheet as your ride-or-die for data management, be it for patient health tracking, personnel management, or financial planning.
🖨 PRINTABLE: Want to share your findings out of the digital world? Our product comes with easy-to-print options.
🔑 DECISION MAKING TOOL: Transform complex data into actionable insights. Our dashboard helps you make informed decisions, fast and efficient.
👑 DECISION MAKER: This tool gives you the power to make the tough decisions via its intelligent design and high usability.
🧹 ORGANIZING TOOL: Say goodbye to cluttered information and hello to organized, easy-to-understand data.
🌐 GOOGLE SHEETS: For Google lovers, the dashboard is entirely compatible, bringing the same efficiency and clarity.
📂 DIGITAL DOWNLOAD: Instant access post-purchase, no waiting, no shipping fees. Get started right away!
🎯 EASY TO USE: We’ve designed this with you in mind. Its user-friendly interface makes it a breeze to use, even for the non-tech savvy.
📁 XLSX: Offering seamless compatibility with your favourite software, be it MS Excel, Google Sheets or other compatible programs.
Experience the ease and efficiency of our Healthcare KPI Dashboard today. Collect, analyze, and achieve all in one go! Thank you for stopping by. Looking forward to elevating your reporting process with our dashboard.
Please don’t hesitate to reach out if you have any questions, we are always here to help! Enjoy shopping and have a fantastic day!
As healthcare professionals, we understand the importance of data-driven decision-making in providing the best patient care and optimizing healthcare operations. Our Healthcare KPI Dashboard Excel template is designed to empower healthcare practitioners, administrators, and analysts with the tools they need to track and analyze key performance indicators effectively.
Why choose our Healthcare KPI Dashboard?
Streamlined Data Analysis: Our template provides a user-friendly interface that simplifies the process of collecting and analyzing crucial healthcare metrics. No more sifting through stacks of papers or struggling with complex spreadsheets. Our dashboard consolidates all the essential KPIs in one place, allowing you to focus on what matters most – improving patient outcomes.
Comprehensive Metrics: Our template covers a wide range of healthcare KPIs, ensuring you have a holistic view of your organization’s performance. From patient satisfaction and readmission rates to average length of stay and revenue per procedure, our dashboard provides insights into every aspect of your healthcare operations.
Customizable and Easy to Use: We understand that every healthcare organization is unique, and that’s why our template is fully customizable. Tailor it to your specific needs by adding or removing KPIs, adjusting timeframes, and customizing visualizations. Even if you’re not an Excel expert, our intuitive design makes it easy to navigate and update your data effortlessly.
Time and Cost Savings: By automating data collection and analysis, our Healthcare KPI Dashboard saves you valuable time and resources. Say goodbye to manual data entry and complex calculations. With just a few clicks, you’ll have real-time insights into your healthcare performance, allowing you to make informed decisions quickly.
Who can benefit from our Healthcare KPI Dashboard?
• Healthcare administrators: Track key metrics to optimize resource allocation, improve efficiency, and enhance patient experience.
• Hospital managers: Monitor patient flow, readmission rates, and revenue per procedure to identify areas for improvement.
• Medical practitioners: Analyze patient satisfaction and clinical outcomes to enhance the quality of care provided.
• Healthcare analysts: Extract actionable insights from data trends and identify opportunities for operational enhancements.
Content:
• Excel file compatible with Excel 2010 and higher (and with sample data)
• Professional Design
• Works both on Mac and Windows
• No installation needed. Ready to use
• Dashboard with charts
• Healthcare KPI Dashboard Template
• Easy to use
• 100% editable
• Excel file
• Instant download
• Friendly customer support for all your questions
License: Private Use (not for distribution or resale)
$ 35 -

Sales KPI Excel Template | KPI Dashbord Report Template | KPI Report Analysis | Sales Performance Tracking Report | Digital Download
Sales KPI Excel Template
A Sales KPI or metric is a performance measurement that is used by sales teams and by the top management to track the effectiveness of relevant sales activities within a company. These measures help in optimizing your sales performance, sales funnel and sales cycle length.
For more details about the template, check the link below;
Best for:
• Sales KPI Dashboard for all types of companies
• Everyone opening a business
• Sales Professionals
• Everyone starting with a new project
• Sales Managers
This tool will help you analyze your Monthly Kpi Metric data.
After you insert your Monthly Numeric data for the KPI Metrics you determine, you can see a clear monthly and cumulative analysis for the metrics you determine. It is also possible to compare your numeric data with your target data and past year data.
Seeing the level of difference of these metrics will help you identify the problem and how to improve your model more effectively and efficiently.
Content:
• Excel file compatible with Excel 2010 and higher (and with sample data)
• Professional Design
• Works both on Mac and Windows
• No installation needed. Ready to use
• Dashboard with charts
• Sales Kpi Dashboard Excel Template
• Easy to use
• 100% editable
• Excel file
• Instant download
• Friendly customer support for all your questions
License: Private Use (not for distribution or resale)
$ 35 -
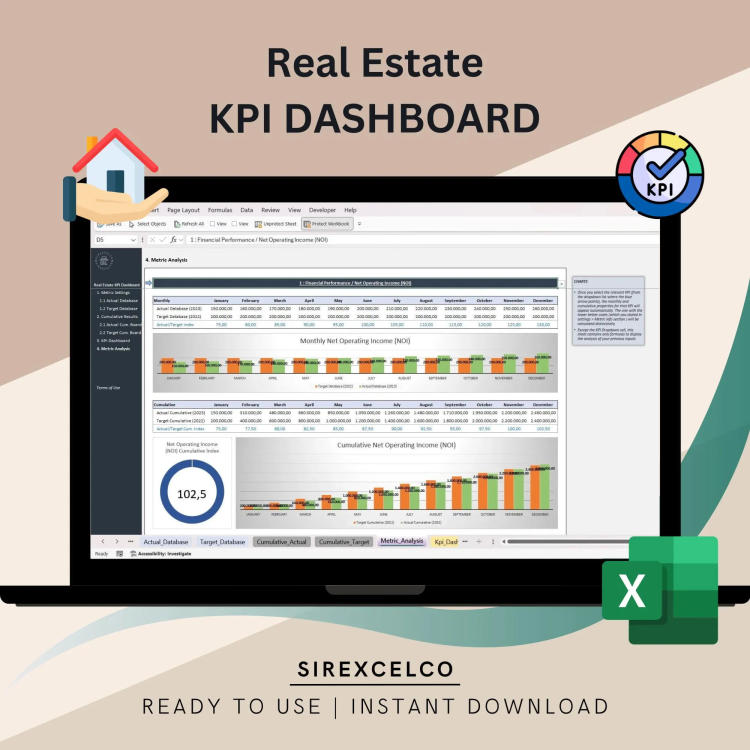
Real Estate KPI Dashboard Excel Template | Dynamic Real Estate Performance Tracker | Monthly & Cumulative KPI Metrics Analysis
Easily track and compare your real estate KPI metrics with our Real Estate KPI Dashboard Excel Template.
For more details about the template, check the link below;
Designed for property managers, real estate professionals, and homeowners, this dynamic Excel template lets you monitor key performance indicators month by month and cumulatively. Compare actual results with target metrics, all represented through customizable dynamic charts. Whether you’re tracking property sales, occupancy rates, or financial performance, this tool provides clear data insights to help optimize your real estate investments. It’s simple to use, making complex performance tracking easier than ever.
With a fully customizable layout, you can tailor the dashboard to suit your specific needs and goals. Monitor your portfolio’s performance and make informed decisions using clear, organized data—all in one place.
Whether you’re managing multiple properties or just getting started, this template will save you time and provide insights that help you grow your business.
Key Features:
Dynamic and fully editable Excel dashboard
Tracks essential real estate KPIs like revenue, occupancy, and expenses
Customizable for any property type or portfolio size
Simple to use, even if you’re not an Excel expert
Ideal for property managers, real estate investors, and agents
Content:
• Excel file compatible with Excel 2010 and higher (and with sample data)
• Professional Design
• Works both on Mac and Windows
• No installation needed. Ready to use
• Dashboard with charts
• Real Estate KPI Dashboard
• Easy to use
• 100% editable
• Excel file
• Instant download
• Friendly customer support for all your questions
License: Private Use (not for distribution or resale)
$ 35 -
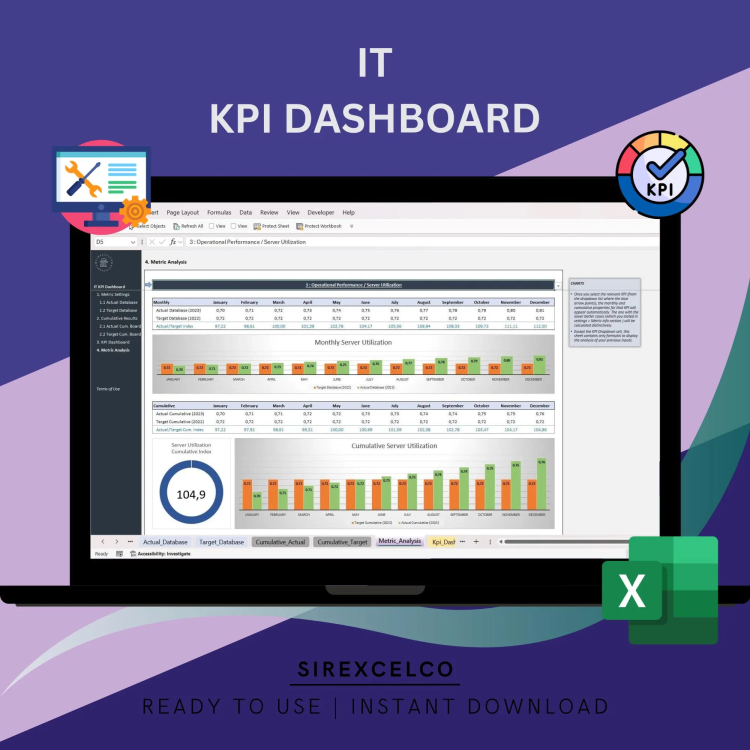
IT KPI Dashboard Excel Template | Monthly Cumulative Performance Tracker | IT Metrics Performance Report | Customizable Editable Spreadsheet
Stay on Top of Your IT Performance with This Easy-to-Use IT KPI Dashboard Template
Are you looking for a simple yet powerful way to track and manage your IT department’s performance? This IT KPI Dashboard Excel Template is designed to help you keep an eye on your key metrics every month. Whether you’re a project manager, IT lead, or small business owner, this template lets you track KPIs month by month, with the added bonus of automatically calculating cumulative results for easy reporting.
For more details about the template, check the link below;
Why You’ll Love This Template:
Track IT KPIs with ease—no complicated software needed.
Monthly and cumulative views for a complete picture of your performance.
Customizable layout to fit your business’s unique needs.
Simple analysis tools to help you pinpoint trends and areas for improvement.
Perfect for IT managers, analysts, and anyone who needs clear, actionable insights.
Save time and stress less with this powerful tool. Get organized, make smarter decisions, and keep your IT projects running smoothly.
Content:
• Excel file compatible with Excel 2010 and higher (and with sample data)
• Professional Design
• Works both on Mac and Windows
• No installation needed. Ready to use
• Dashboard with charts
• IT KPI Dashboard
• Easy to use
• 100% editable
• Excel file
• Instant download
• Friendly customer support for all your questions
$ 35