


Streamline production processes and improve quality control with our templates and tools for manufacturing businesses. Access production planning software, quality control systems, and supply chain management tools.
-
Dynamic Gantt Chart Excel Template for Team Work Management | Easy Database Entry & Tracking | Visual Project Planning Tool
Efficiently manage your team’s projects with this dynamic Gantt Chart Excel Template.
Perfect for tracking tasks and deadlines, this template allows you to enter all your team’s work into a database and instantly visualize it on a Gantt chart. Ideal for project managers and team leaders looking for a simple yet effective tool for organizing workloads and timelines. With dynamic charts and easy-to-use functionality, this template streamlines project tracking without the need for complex software.
For more details about the template, check the link below;
Best for:
• Talent Professionals
• HR Professionals
• All types of companies
Content:
• Excel file compatible with Excel 2007 and higher (and with sample data)
• Professional Design
• Works both on Mac and Windows
• No installation needed. Ready to use
• Gantt Chart Excel Template
• Easy to use
• 100% editable
• Excel file
• Instant download
• Friendly customer support for all your questions
License: Private Use (not for distribution or resale)
$ 8 -
Annual Expense Tracker, Finance Budget Excel Template, Monthly Financial Planner Spreadsheet, Personal Finance Template
Introducing the Annual Expense Tracker Excel Template
A must-have tool for anyone looking to take control of their personal finances and achieve their financial goals! Created with care by Sirexcelco, this budgeting masterpiece combines the power of an Annual Budget, Monthly Budget, and Expense Tracker into one convenient spreadsheet.
For more details about the template, check the link below;
Say goodbye to financial stress and hello to financial freedom with our user-friendly Budget Template. It’s the perfect companion to guide you on your journey towards a healthier financial future. This Budget Planner empowers you to stay on top of your expenses, track your expense, and make informed financial decisions.
With the Annual Expense Tracker Excel Template, you’ll effortlessly become the master of your money. Start by organizing your finances using our intuitive Budget Spreadsheet. Seamlessly monitor your expense. This comprehensive Finance Planner equips you with the tools to analyze your spending patterns, identify areas for improvement, and create a personalized financial strategy.
Don’t let your dreams remain unfulfilled. Take the first step towards a prosperous tomorrow. Get your hands on the Annual Expense Tracker Excel Template and experience the transformation it brings to your financial life.
Content:
• Excel file compatible with Excel 2007 and higher (and with sample data)
• Professional Design
• Works both on Mac and Windows
• No installation needed. Ready to use
• Annual Expense Tracker Template
• Easy to use
• 100% editable
• Excel file
• Instant download
• Friendly customer support for all your questions
License: Private Use (not for distribution or resale)
$ 10 -
Dynamic CRM Excel Template | All-in-One CRM Software Solution | Salesman Analysis | Track, Manage, & Visualize CRM Data | Easy-to-Use
Dynamic CRM Excel Template
Looking for a CRM solution without the need for complex software? This dynamic CRM Excel template is the perfect tool for tracking and managing your customer data with ease! It offers everything a CRM software does, right within Excel.
For more details about the template, check the link below;
With dynamic charts that automatically adjust based on dates, you’ll have real-time insights at your fingertips. It’s customizable, easy to use, and gives you full control over your customer relationships. Whether you’re a small business owner or a freelancer, this Excel template simplifies CRM management and helps you stay organized, all while keeping your data in one place. Perfect for users looking for flexibility and power without the high cost of traditional CRM software.
Content:
• Excel file compatible with Excel 2010 and higher (and with sample data)
• Professional Design
• Works both on Mac and Windows
• No installation needed. Ready to use
• Dashboard with charts
• CRM Excel Template
• Easy to use
• 100% editable
• Excel file
• Instant download
• Friendly customer support for all your questions
License: Private Use (not for distribution or resale)
✨Explore the exquisite design of our robust and versatile CRM Excel Template, your ultimate guide for smart customer relationship management. Handcrafted expressly for you to manage and track your customer database and leads with ease and style. 🧩
🔮 Features:
👥 A comprehensive Customer Database to store all your client’s information
📊 A CRM Dashboard Excel to monitor and analyse data intuitively
🏠 Ideal CRM for Realtors to handle contacts, track leads, and manage interactions
📑 Seamlessly integrates with CRM Google Sheet, simplifying data entry and analysis
🎁 An all-in-one CRM Template that is easy to use and adaptable to your business needs
💟 A CRM Tracker that helps you to accurately monitor sales activities
🚀 Specifically designed as a Track Customer Spreadsheet to maintain a clean and organized database
👑 Extraordinarily detailed, our CRM Excel Template offers the perfect blend of utility and elegance, making it an invaluable tool for any thriving business! 🧲
$ 20 -
Risk Management KPI Dashboard Excel Template, Excel Risk Metrics Report Template Digital File, Risk Assessment Dynamic Reporting Tracker
Risk Management KPI Dashboard
Introducing our cutting-edge “Risk Management KPI Dashboard | Excel Risk Metrics Report Template | Dynamic Analytics Tool | Decision-Making Companion.” This meticulously crafted, dynamic reporting tool is poised to revolutionize the way you navigate and optimize your risk management processes.
For more details about the template, check the link below;
Crafted with precision using Microsoft Excel and Google Sheets, this digital download transcends the boundaries of a typical spreadsheet – it’s your strategic ally in decision-making.
✨Instant Download: No waiting required. Access your dashboard immediately after purchase.
📊Excel Dashboard: Effortlessly view and manage a wealth of data for comprehensive risk analysis.
📉Risk Management KPI: Track multiple key performance indicators in a centralized location for maximum efficiency.
📝Metrics Report Template: Streamline the creation of detailed reports, allowing you to focus on strategic planning.
🎯Dynamic Analytics Tool: Monitor progress, identify trends, and achieve your risk management objectives with ease.
📑Excel Template: Top-notch design for user-friendly experience, adaptability, and accuracy.
Product Specifications:
💽File Type: XLSX
📈Form/Template: Excel Spreadsheet, Excel Sheet
✅Requirement: Microsoft Excel
💻Compatibility: Google Sheets
🏷️Function: Printable, Decision Making Tool, Data Organizer, Analytics Tool
🌐Access: Fully accessible and easy to use.
Craftsmanship: This isn’t just an Excel sheet; it’s a robust planning tool with meticulous attention to detail. Every element is carefully designed to ensure your success. The tool is easily customizable to suit your exact needs and built to evolve with your risk management strategies.
Digital Materials: Spreadsheet, Microsoft Excel, Excel Spreadsheet, Excel Sheet, Printable, Decision Making Tool, Analytics Tool, Google Sheets, Easy to Use, XLSX, Excel.
Thank you for choosing our product. Your success is a testament to our commitment to creating impactful tools. We appreciate your choice and honor the craftsmanship that goes into developing our products.
Make sure to explore other innovative products in our shop – each meticulously designed to support and enhance your projects. Take your time, and you’ll discover numerous tools to assist, inspire, and elevate your risk management endeavors. Wishing you abundant success!
$ 35 -
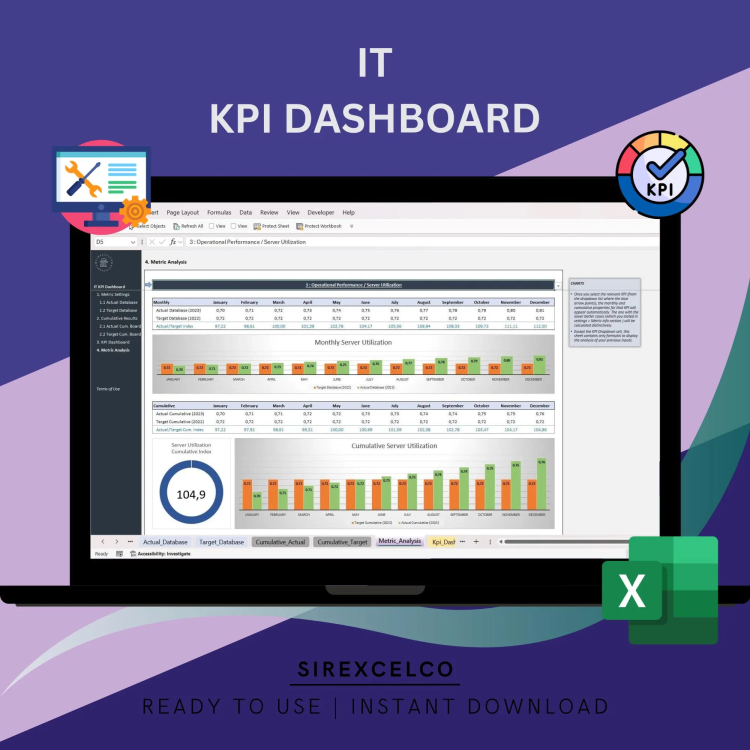
IT KPI Dashboard Excel Template | Monthly Cumulative Performance Tracker | IT Metrics Performance Report | Customizable Editable Spreadsheet
Stay on Top of Your IT Performance with This Easy-to-Use IT KPI Dashboard Template
Are you looking for a simple yet powerful way to track and manage your IT department’s performance? This IT KPI Dashboard Excel Template is designed to help you keep an eye on your key metrics every month. Whether you’re a project manager, IT lead, or small business owner, this template lets you track KPIs month by month, with the added bonus of automatically calculating cumulative results for easy reporting.
For more details about the template, check the link below;
Why You’ll Love This Template:
Track IT KPIs with ease—no complicated software needed.
Monthly and cumulative views for a complete picture of your performance.
Customizable layout to fit your business’s unique needs.
Simple analysis tools to help you pinpoint trends and areas for improvement.
Perfect for IT managers, analysts, and anyone who needs clear, actionable insights.
Save time and stress less with this powerful tool. Get organized, make smarter decisions, and keep your IT projects running smoothly.
Content:
• Excel file compatible with Excel 2010 and higher (and with sample data)
• Professional Design
• Works both on Mac and Windows
• No installation needed. Ready to use
• Dashboard with charts
• IT KPI Dashboard
• Easy to use
• 100% editable
• Excel file
• Instant download
• Friendly customer support for all your questions
$ 35 -
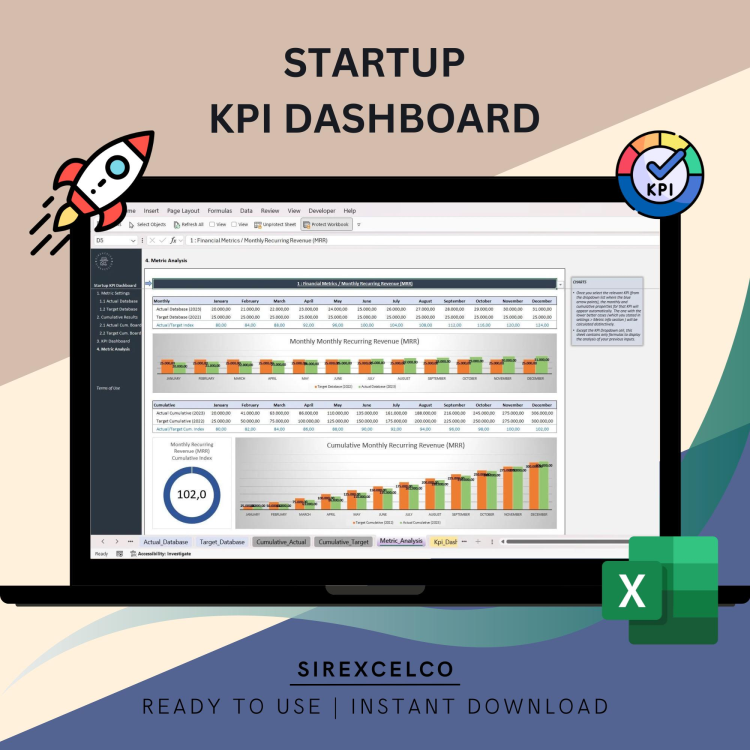
Startup KPI Dashboard Excel Template | Dynamic Monthly & Cumulative KPI Metrics Tracker | Target vs Actual Performance Analysis
Monitor your startup’s key performance indicators effortlessly with our Startup KPI Dashboard Excel Template.
This easy-to-use, dynamic tool allows you to track essential metrics month by month and cumulatively. Compare your startup’s actual performance against target metrics and visualize your data with customizable, dynamic charts. Whether you’re measuring sales, customer acquisition, or growth metrics, this template offers actionable insights to help your startup scale efficiently. Ideal for founders, startup teams, and entrepreneurs seeking clear, data-driven decision-making tools.
For more details about the template, check the link below;
Customizable and easy to use, you can tailor this dashboard to fit your unique business needs. Save time on reporting and focus on growing your startup by having all the important data clearly organized in a single, easy-to-read dashboard.
This tool is perfect for founders, entrepreneurs, and startup teams looking for an efficient way to monitor their KPIs and make data-driven decisions.
Key Features:
Dynamic and fully editable Excel template
Track essential startup KPIs including revenue, customer acquisition, and expenses
Customizable layout to suit your startup’s specific goals
User-friendly, no advanced Excel skills needed
Perfect for startup founders, business owners, and growth teams
Content:
• Excel file compatible with Excel 2010 and higher (and with sample data)
• Professional Design
• Works both on Mac and Windows
• No installation needed. Ready to use
• Dashboard with charts
• Startup KPI Dashboard
• Easy to use
• 100% editable
• Excel file
• Instant download
• Friendly customer support for all your questions
License: Private Use (not for distribution or resale)
$ 35 -

Used Car Dealership Financial Model
Plan, manage, and scale your dealership operations with this advanced Used Car Dealership Financial Model. Featuring dynamic inventory logic, detailed financial statements, a cap table, and robust visualizations, it helps forecast equity needs, EBITDA, and cash flow over five years. Ideal for startups and established dealerships, this tool ensures accurate planning and strategic insights.
$ 45 -

Trucking Business Financial Model
This comprehensive financial model is tailored for trucking businesses, offering detailed forecasting for five years. Features include revenue and expense projections, truck purchase or lease options, cash flow statements, debt schedules, and terminal value calculations. Visualizations, KPIs, and executive summaries enhance strategic planning and decision-making. Ideal for startups or scaling operations.
$ 45 -

Manufacturing Process Tracker
This Excel template provides a manufacturing database example for tracking production runs, maintenance records, quality checks, and supplier information. It includes a dashboard for visualizing production efficiency, throughput, and other key performance indicators.
$ 45 -

Pareto Analysis
This Excel-based Pareto Analysis template provides a dynamic tool for identifying and prioritizing key areas of improvement across various business functions. It features automated data ordering, conditional formatting, and visual charts to facilitate clear and actionable insights.
$ 45Pareto Analysis
$ 45 -

Manufacturing KPI Management Excel Dashboard
A manufacturing key performance indicator (KPI) is a clearly defined metric used to track, analyze, and improve production processes.
$ 49 -

General Rental Business Financial Model
This Excel-based model forecasts the financial performance of a general rental business over 5 years. It includes detailed revenue calculations based on rental categories and utilization rates, comprehensive expense modeling, 3-statement financial reports, IRR analysis, cap table management, and exit valuation.
$ 75


