- “Comprehensive All in One Stock Inventory Tracker Excel Template | Manage Stock, Team, Orders, Profitability & Sales Analysis Easily” already exists in your wishlist
-
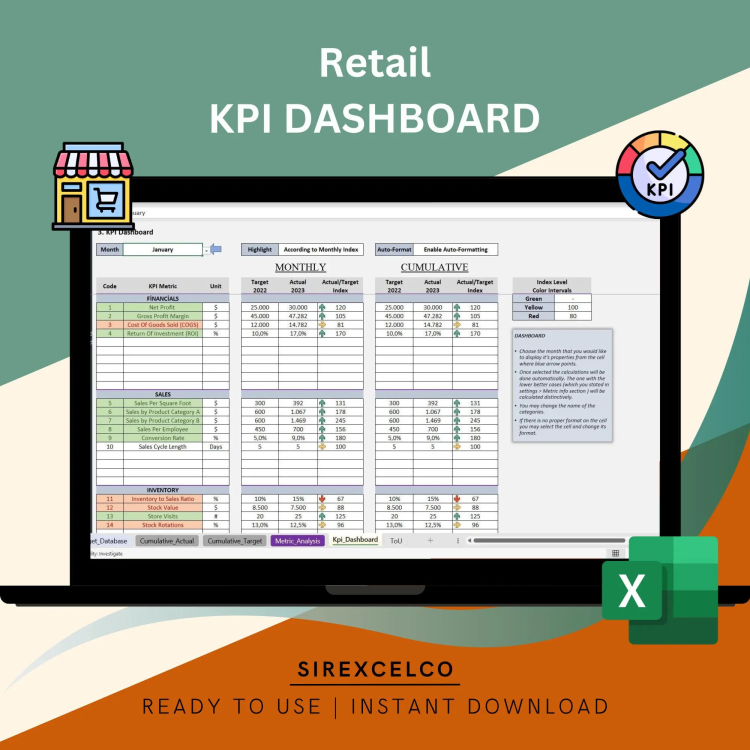
Retail KPI Dashboard Excel Template | Dynamic Monthly & Cumulative Metrics Tracker | Target vs Actual Performance Analysis
Track and analyze your retail business performance with our Retail KPI Dashboard Excel Template!
For more details about the template, check the link below;
This dynamic, easy-to-use template helps you monitor key retail metrics month by month and cumulatively, providing a clear comparison of target metrics versus actual performance. Whether you’re tracking sales, inventory, or customer engagement, this template features dynamic charts that adjust based on the selected metric, giving you real-time insights to make data-driven decisions. Ideal for retail managers and business owners looking to optimize their operational efficiency and performance.
Best for:
• Retail industry
• E-commerce
• Everyone starting with a new project
Content:
• Excel file compatible with Excel 2010 and higher (and with sample data)
• Professional Design
• Works both on Mac and Windows
• No installation needed. Ready to use
• Dashboard with charts
• Retail Kpi Dashboard Template
• Easy to use
• 100% editable
• Excel file
• Instant download
• Friendly customer support for all your questions
License: Private Use (not for distribution or resale)
$ 35 -

Sales KPI Excel Template | KPI Dashbord Report Template | KPI Report Analysis | Sales Performance Tracking Report | Digital Download
Sales KPI Excel Template
A Sales KPI or metric is a performance measurement that is used by sales teams and by the top management to track the effectiveness of relevant sales activities within a company. These measures help in optimizing your sales performance, sales funnel and sales cycle length.
For more details about the template, check the link below;
Best for:
• Sales KPI Dashboard for all types of companies
• Everyone opening a business
• Sales Professionals
• Everyone starting with a new project
• Sales Managers
This tool will help you analyze your Monthly Kpi Metric data.
After you insert your Monthly Numeric data for the KPI Metrics you determine, you can see a clear monthly and cumulative analysis for the metrics you determine. It is also possible to compare your numeric data with your target data and past year data.
Seeing the level of difference of these metrics will help you identify the problem and how to improve your model more effectively and efficiently.
Content:
• Excel file compatible with Excel 2010 and higher (and with sample data)
• Professional Design
• Works both on Mac and Windows
• No installation needed. Ready to use
• Dashboard with charts
• Sales Kpi Dashboard Excel Template
• Easy to use
• 100% editable
• Excel file
• Instant download
• Friendly customer support for all your questions
License: Private Use (not for distribution or resale)
$ 35 -

Social Media KPI Dashboard Excel Template | Track Social Media Metrics | Monthly & Cumulative Analysis | Dynamic Social Media Reports
Easily track and analyze your social media performance with this Social Media KPI Dashboard Excel Template.
For more details about the template, check the link below;
Ideal for marketers, influencers, and social media managers, this template helps you monitor your monthly and cumulative social media KPIs. Compare actual performance against target metrics, visualize data through dynamic charts, and gain insights to optimize your social media strategies. Whether you’re measuring engagement, growth, or content performance, this template makes managing your social media metrics simple and efficient.
Designed for marketers, influencers, and business owners, this template is incredibly user-friendly and requires no advanced Excel skills. Simply input your data, choose the metric you want to focus on, and the template will automatically generate charts to help you monitor your success.
Key Features:
Track social media metrics monthly and cumulatively
Compare target metrics vs actual performance
Dynamic charts that update based on selected metrics
User-friendly and fully customizable
Perfect for marketers, influencers, and social media managers
No advanced Excel knowledge needed
This template is an essential tool for anyone looking to improve their social media strategy and measure performance with accuracy.
Best for:
• Socal Media Experts
• Bloggers
• Everyone starting with a new project
• Marketing Experts
• Influencers
• Everyone opening a business
This tool will help you analyze your Monthly Kpi Metric data.
After you insert your Monthly Numeric data for the KPI Metrics you determine, you can see a clear monthly and cumulative analysis for the metrics you determine. It is also possible to compare your numeric data with your target data and past year data.
Seeing the level of difference of these metrics will help you identify the problem and how to improve your model more effectively and efficiently.
Content:
• Excel file compatible with Excel 2010 and higher (and with sample data)
• Professional Design
• Works both on Mac and Windows
• No installation needed. Ready to use
• Dashboard with charts
• Social Media KPI Dashboard Template
• Easy to use
• 100% editable
• Excel file
• Instant download
• Friendly customer support for all your questions
License: Private Use (not for distribution or resale)
Thanks for visiting!
$ 35 -

Supply Chain and Logistics KPI Dashboard, Excel Template, Dynamic Reporting Dashboard Sheets, Performance Tracking XLSX
Supply Chain and Logistics KPI Dashboard
A logistics KPI or metric is a performance measurement that is used by logistics managers to track, visualize and optimize all relevant logistic processes in an efficient way.
For more details about the template, check the link below;
Best for:
• Logistics Managers
• Operation Managers
• Shipping Businesses
• Transportation Businesses
• Order management
• Delivery Businesses
This tool will help you analyze your Monthly Kpi Metric data.
After you insert your Monthly Numeric data for the KPI Metrics you determine, you can see a clear monthly and cumulative analysis for the metrics you determine. It is also possible to compare your numeric data with your target data and past year data.
Seeing the level of difference of these metrics will help you identify the problem and how to improve your model more effectively and efficiently.
Content:
• Excel file compatible with Excel 2010 and higher (and with sample data)
• Professional Design
• Works both on Mac and Windows
• No installation needed. Ready to use
• Dashboard with charts
• Supply Chain and Logistics KPI Dashboard
• Easy to use
• 100% editable
• Excel file
• Instant download
• Friendly customer support for all your questions
License: Private Use (not for distribution or resale)
$ 35 -
The Essence of Toyota Way (PDF) as explained by Dr. Jeffrey Liker
The Toyota Way to Lean Excellence
This presentation outlines the Toyota Way philosophy, detailing its core principles and historical development. It explains Lean manufacturing as a systematic approach to eliminate waste, improve flow, and foster continuous improvement, highlighting its application beyond traditional manufacturing to sectors like healthcare. The four Ps of the Toyota Way – Philosophy, Process, People and Partners, and Problem Solving – are introduced as foundational elements for sustained excellence. Through case studies, such as the Donnelly Mirrors plant, the material illustrates how these principles lead to significant improvements in quality, cost, and lead time. Finally, the presentation stresses the importance of people development and a long-term commitment from leadership to embed a culture of continuous improvement, preventing entropy and ensuring the enduring success of lean implementation.$ 99$ 109 -
The Power and Magic of Lean by
The Power and Magic of Lean
The provided source offers an extensive overview of Lean principles and continuous improvement methodologies, largely attributed to the Toyota Production System (TPS). It introduces Norman Bodek, a prominent figure in propagating Japanese management techniques in the West, detailing his contributions and the various Lean tools he introduced, such as SMED, Poka-yoke, and Kaizen. The document meticulously outlines the nine wastes (Muda) that Lean aims to eliminate, including overproduction, waiting, and non-utilised talent, and explores concepts like Jidoka and Just-in-Time (JIT). Furthermore, it contrasts the characteristics of leaders and managers within a Lean context, emphasising the importance of respect for people and total employee involvement through practices like Quick and Easy Kaizen to foster a culture of perpetual small-scale improvements.$ 129$ 135The Power and Magic of Lean by
$ 129$ 135 -
Waterfall Project Planner, Project Plan Gantt Chart & Resource Cost / Budget / Revenue Tracker – MS Microsoft Excel (x2)
Waterfall Project Planner with Plan Gantt View and Project Resource Cost Tracker – MS Microsoft Excel Template (2 comprehensive templates for the price of one)
$ 30$ 40