-

Retail Sales Scaling Locations Financial Model
This 5-year financial model is designed for scaling up to 25 retail locations, making it ideal for restaurants, home goods stores, or similar businesses. The template includes dynamic logic for variable start dates, capacity growth, multi-ticket revenue streams, labor, and COGS projections. With built-in IRR, NPV analysis, and breakeven calculations, the model ensures precision in forecasting operational scaling and profitability.
$ 45 -

Risk Management KPI Dashboard Excel Template, Excel Risk Metrics Report Template Digital File, Risk Assessment Dynamic Reporting Tracker
Risk Management KPI Dashboard
Introducing our cutting-edge “Risk Management KPI Dashboard | Excel Risk Metrics Report Template | Dynamic Analytics Tool | Decision-Making Companion.” This meticulously crafted, dynamic reporting tool is poised to revolutionize the way you navigate and optimize your risk management processes.
For more details about the template, check the link below;
Crafted with precision using Microsoft Excel and Google Sheets, this digital download transcends the boundaries of a typical spreadsheet – it’s your strategic ally in decision-making.
✨Instant Download: No waiting required. Access your dashboard immediately after purchase.
📊Excel Dashboard: Effortlessly view and manage a wealth of data for comprehensive risk analysis.
📉Risk Management KPI: Track multiple key performance indicators in a centralized location for maximum efficiency.
📝Metrics Report Template: Streamline the creation of detailed reports, allowing you to focus on strategic planning.
🎯Dynamic Analytics Tool: Monitor progress, identify trends, and achieve your risk management objectives with ease.
📑Excel Template: Top-notch design for user-friendly experience, adaptability, and accuracy.
Product Specifications:
💽File Type: XLSX
📈Form/Template: Excel Spreadsheet, Excel Sheet
✅Requirement: Microsoft Excel
💻Compatibility: Google Sheets
🏷️Function: Printable, Decision Making Tool, Data Organizer, Analytics Tool
🌐Access: Fully accessible and easy to use.
Craftsmanship: This isn’t just an Excel sheet; it’s a robust planning tool with meticulous attention to detail. Every element is carefully designed to ensure your success. The tool is easily customizable to suit your exact needs and built to evolve with your risk management strategies.
Digital Materials: Spreadsheet, Microsoft Excel, Excel Spreadsheet, Excel Sheet, Printable, Decision Making Tool, Analytics Tool, Google Sheets, Easy to Use, XLSX, Excel.
Thank you for choosing our product. Your success is a testament to our commitment to creating impactful tools. We appreciate your choice and honor the craftsmanship that goes into developing our products.
Make sure to explore other innovative products in our shop – each meticulously designed to support and enhance your projects. Take your time, and you’ll discover numerous tools to assist, inspire, and elevate your risk management endeavors. Wishing you abundant success!
$ 35 -

Sales KPI Excel Template | KPI Dashbord Report Template | KPI Report Analysis | Sales Performance Tracking Report | Digital Download
Sales KPI Excel Template
A Sales KPI or metric is a performance measurement that is used by sales teams and by the top management to track the effectiveness of relevant sales activities within a company. These measures help in optimizing your sales performance, sales funnel and sales cycle length.
For more details about the template, check the link below;
Best for:
• Sales KPI Dashboard for all types of companies
• Everyone opening a business
• Sales Professionals
• Everyone starting with a new project
• Sales Managers
This tool will help you analyze your Monthly Kpi Metric data.
After you insert your Monthly Numeric data for the KPI Metrics you determine, you can see a clear monthly and cumulative analysis for the metrics you determine. It is also possible to compare your numeric data with your target data and past year data.
Seeing the level of difference of these metrics will help you identify the problem and how to improve your model more effectively and efficiently.
Content:
• Excel file compatible with Excel 2010 and higher (and with sample data)
• Professional Design
• Works both on Mac and Windows
• No installation needed. Ready to use
• Dashboard with charts
• Sales Kpi Dashboard Excel Template
• Easy to use
• 100% editable
• Excel file
• Instant download
• Friendly customer support for all your questions
License: Private Use (not for distribution or resale)
$ 35 -

Shopping Center Acquisition – 10 Year Financial Model
10-Year financial model for a shopping center acquisition projecting rental income, operating expenses, and cash flow based on tenant mix, lease terms, occupancy rates, and market rent levels. It includes detailed forecasts for acquisition costs, financing terms, property taxes, maintenance, utilities, management fees, and potential rent escalations. The model helps assess profitability, calculate return on investment (ROI), and guide decisions on lease negotiations, tenant improvements, and long-term asset management strategy.
$ 149 -

Social Media KPI Dashboard Excel Template | Track Social Media Metrics | Monthly & Cumulative Analysis | Dynamic Social Media Reports
Easily track and analyze your social media performance with this Social Media KPI Dashboard Excel Template.
For more details about the template, check the link below;
Ideal for marketers, influencers, and social media managers, this template helps you monitor your monthly and cumulative social media KPIs. Compare actual performance against target metrics, visualize data through dynamic charts, and gain insights to optimize your social media strategies. Whether you’re measuring engagement, growth, or content performance, this template makes managing your social media metrics simple and efficient.
Designed for marketers, influencers, and business owners, this template is incredibly user-friendly and requires no advanced Excel skills. Simply input your data, choose the metric you want to focus on, and the template will automatically generate charts to help you monitor your success.
Key Features:
Track social media metrics monthly and cumulatively
Compare target metrics vs actual performance
Dynamic charts that update based on selected metrics
User-friendly and fully customizable
Perfect for marketers, influencers, and social media managers
No advanced Excel knowledge needed
This template is an essential tool for anyone looking to improve their social media strategy and measure performance with accuracy.
Best for:
• Socal Media Experts
• Bloggers
• Everyone starting with a new project
• Marketing Experts
• Influencers
• Everyone opening a business
This tool will help you analyze your Monthly Kpi Metric data.
After you insert your Monthly Numeric data for the KPI Metrics you determine, you can see a clear monthly and cumulative analysis for the metrics you determine. It is also possible to compare your numeric data with your target data and past year data.
Seeing the level of difference of these metrics will help you identify the problem and how to improve your model more effectively and efficiently.
Content:
• Excel file compatible with Excel 2010 and higher (and with sample data)
• Professional Design
• Works both on Mac and Windows
• No installation needed. Ready to use
• Dashboard with charts
• Social Media KPI Dashboard Template
• Easy to use
• 100% editable
• Excel file
• Instant download
• Friendly customer support for all your questions
License: Private Use (not for distribution or resale)
Thanks for visiting!
$ 35 -
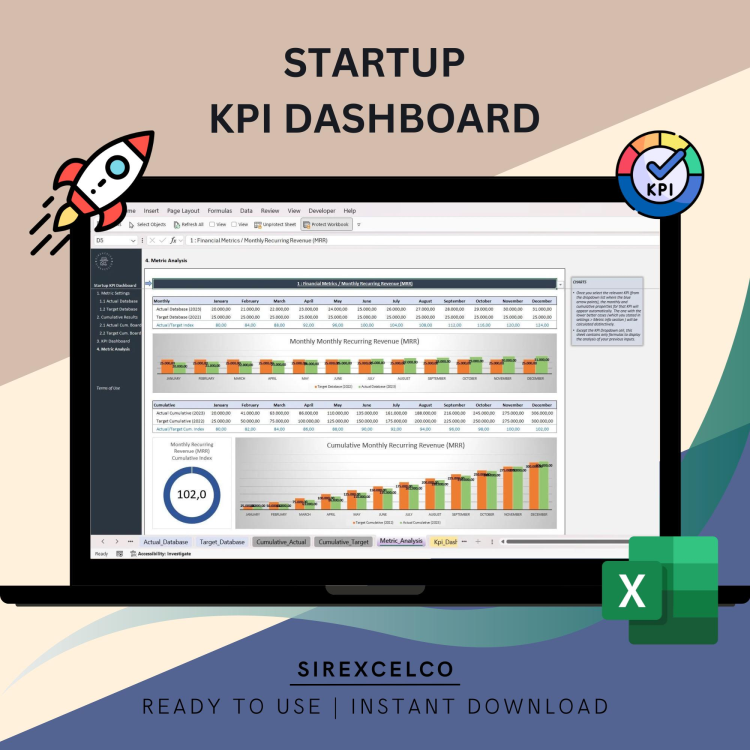
Startup KPI Dashboard Excel Template | Dynamic Monthly & Cumulative KPI Metrics Tracker | Target vs Actual Performance Analysis
Monitor your startup’s key performance indicators effortlessly with our Startup KPI Dashboard Excel Template.
This easy-to-use, dynamic tool allows you to track essential metrics month by month and cumulatively. Compare your startup’s actual performance against target metrics and visualize your data with customizable, dynamic charts. Whether you’re measuring sales, customer acquisition, or growth metrics, this template offers actionable insights to help your startup scale efficiently. Ideal for founders, startup teams, and entrepreneurs seeking clear, data-driven decision-making tools.
For more details about the template, check the link below;
Customizable and easy to use, you can tailor this dashboard to fit your unique business needs. Save time on reporting and focus on growing your startup by having all the important data clearly organized in a single, easy-to-read dashboard.
This tool is perfect for founders, entrepreneurs, and startup teams looking for an efficient way to monitor their KPIs and make data-driven decisions.
Key Features:
Dynamic and fully editable Excel template
Track essential startup KPIs including revenue, customer acquisition, and expenses
Customizable layout to suit your startup’s specific goals
User-friendly, no advanced Excel skills needed
Perfect for startup founders, business owners, and growth teams
Content:
• Excel file compatible with Excel 2010 and higher (and with sample data)
• Professional Design
• Works both on Mac and Windows
• No installation needed. Ready to use
• Dashboard with charts
• Startup KPI Dashboard
• Easy to use
• 100% editable
• Excel file
• Instant download
• Friendly customer support for all your questions
License: Private Use (not for distribution or resale)
$ 35 -

Supply Chain and Logistics KPI Dashboard, Excel Template, Dynamic Reporting Dashboard Sheets, Performance Tracking XLSX
Supply Chain and Logistics KPI Dashboard
A logistics KPI or metric is a performance measurement that is used by logistics managers to track, visualize and optimize all relevant logistic processes in an efficient way.
For more details about the template, check the link below;
Best for:
• Logistics Managers
• Operation Managers
• Shipping Businesses
• Transportation Businesses
• Order management
• Delivery Businesses
This tool will help you analyze your Monthly Kpi Metric data.
After you insert your Monthly Numeric data for the KPI Metrics you determine, you can see a clear monthly and cumulative analysis for the metrics you determine. It is also possible to compare your numeric data with your target data and past year data.
Seeing the level of difference of these metrics will help you identify the problem and how to improve your model more effectively and efficiently.
Content:
• Excel file compatible with Excel 2010 and higher (and with sample data)
• Professional Design
• Works both on Mac and Windows
• No installation needed. Ready to use
• Dashboard with charts
• Supply Chain and Logistics KPI Dashboard
• Easy to use
• 100% editable
• Excel file
• Instant download
• Friendly customer support for all your questions
License: Private Use (not for distribution or resale)
$ 35 -
Waterfall Project Planner, Project Plan Gantt Chart & Resource Cost / Budget / Revenue Tracker – MS Microsoft Excel (x2)
Waterfall Project Planner with Plan Gantt View and Project Resource Cost Tracker – MS Microsoft Excel Template (2 comprehensive templates for the price of one)
$ 30$ 40 -
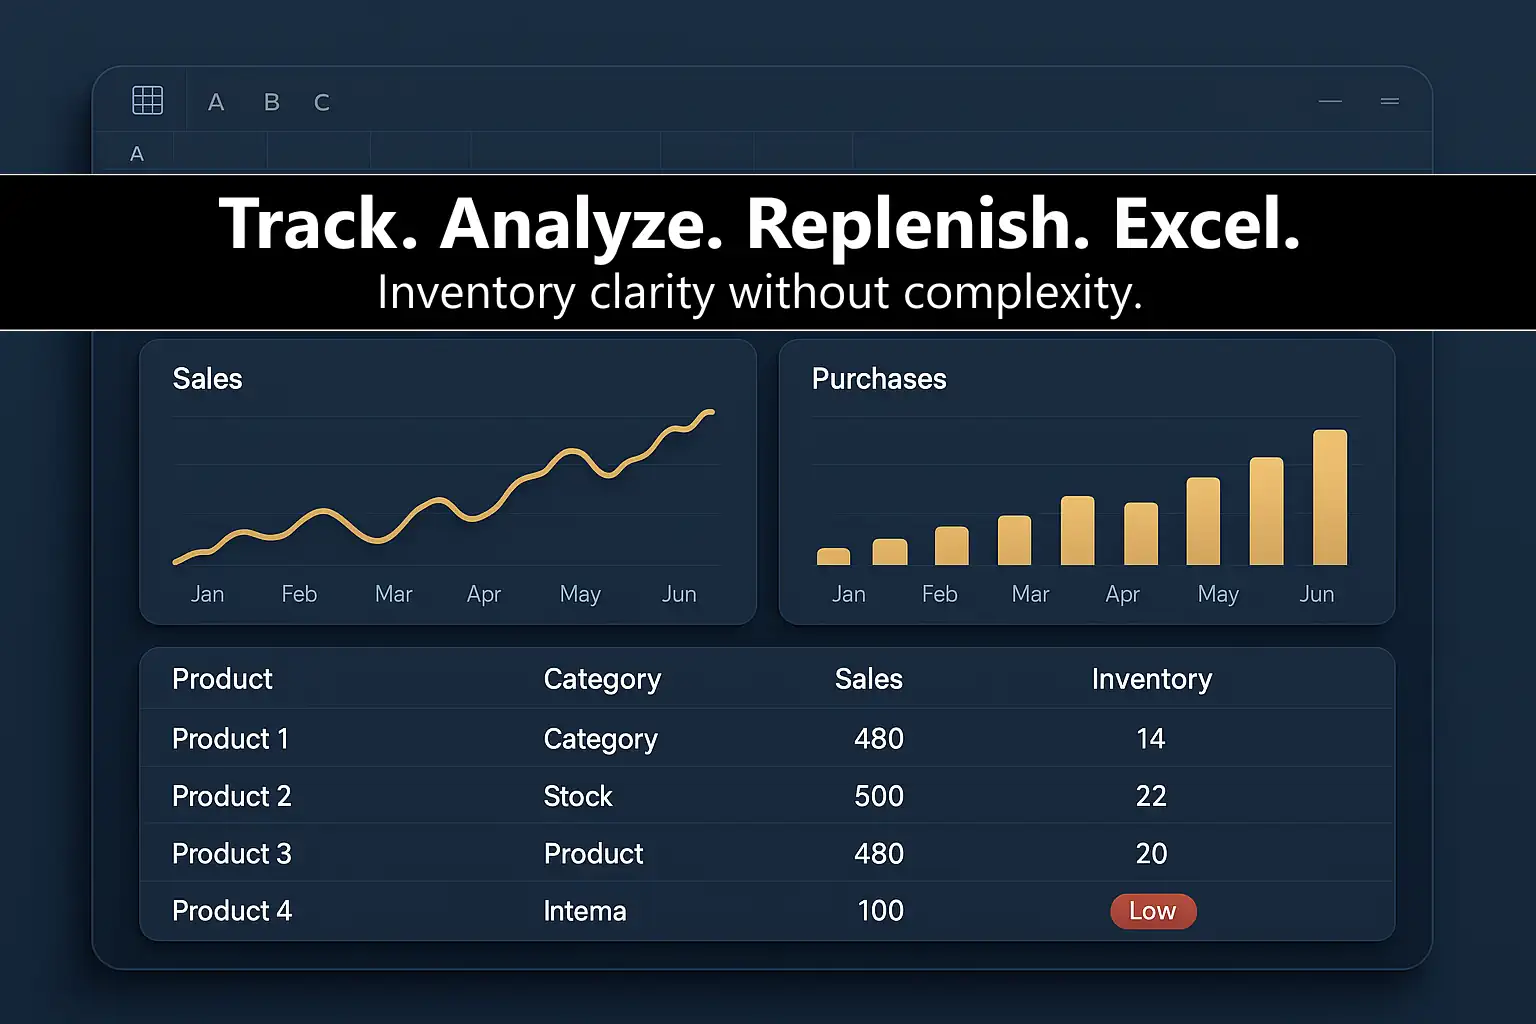
XL Inventory – Inventory, Billing & Profit Tracking
All-in-one Excel system to track stock, create invoices, and see profit at a glance. Automation-ready dashboards, printable docs, and clean workflows — no subscriptions.
$ 199 -
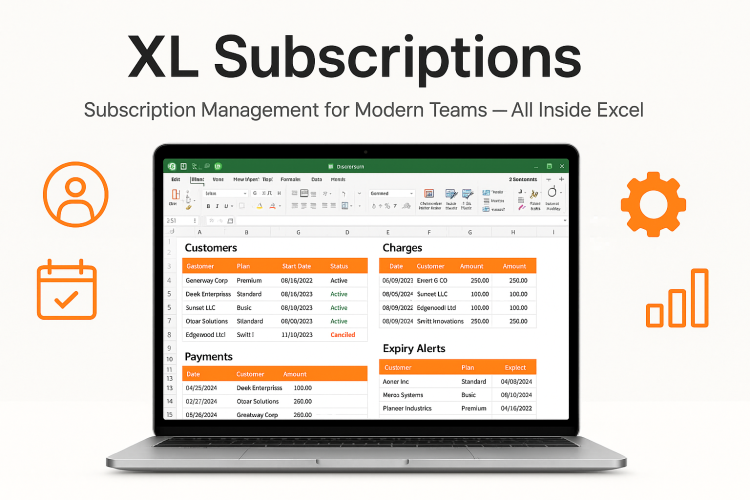
XL Subscriptions
Manage recurring and one-off services in a single Excel file: clients, charges, payments, renewals — with automated expiry alerts and printable client statements. Macros required.
$ 149XL Subscriptions
$ 149