-

Comprehensive All in One Stock Inventory Tracker Excel Template | Manage Stock, Team, Orders, Profitability & Sales Analysis Easily
Easily manage and monitor your inventory, sales, and orders with this Comprehensive Stock Inventory & Sales Tracker Excel Template.
Perfect for shop owners and small businesses, this dynamic and user-friendly template simplifies stock management, tracks sold and purchased products, and enables detailed sales, profit, and procurement analysis. With automated, interactive charts and a straightforward design, it provides insights into your inventory levels and financial performance, helping you make data-driven business decisions. An essential tool for efficiently managing stock and tracking profitability in one place.📊
🔸Immaculate Inventory management: Our Inventory Sheet is an unparalleled tool that lets you handle your stock like a pro. Instantly process, track, and modify your stock details on the go. No more inconsistencies or stockouts!
🔸Dynamic Sales Team Dashboard: Track your sales progress with breakthrough clarity. Monitor your sales team’s performance in real time with our intuitive dashboard. Drive your sales conversion soaring high! 💼
🔸Smart Profit and Loss Statements: Easily generate automatic profit and loss statements. Get a clear picture of your business financial health with this robust feature. Navigate your business decisions with greater confidence. 💰
🔸Exquisite Excel made: Crafted with mastery in Excel, this digital download template ensures quick, error-free calculations and incomparable user experience. Master your inventory and sales in just a few clicks. 🖥️
🔸Ready, set, track! Unleash the power of organized and systematic Inventory and Stock Management with our All in One Stock Inventory Tracker. Download now and witness a revolution in the way you handle your inventory and sales! 📈
Have questions or need help? Don’t hesitate to reach out! Also, keep an eye on my shop for regular product updates and brand-new additions.
Thank you for choosing our All in One Stock Inventory Tracker. We can’t wait to be part of your business success story! 🎉
$ 22 -

-

-

Marketing Budget Analysis
Marketing expenditure refers to the total amount an organization allocates to its marketing activities.
$ 29 -

Project Management Excel Template
Introducing our advanced Project Management Excel Template, crafted to elevate your project planning and budgeting efficiency.
$ 29 -
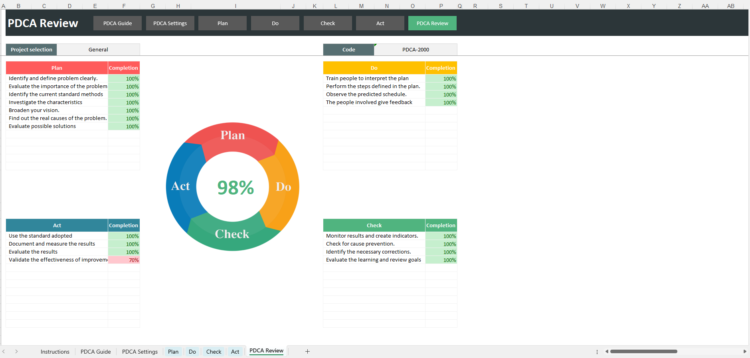
PDCA (Plan–Do–Check–Act) Excel Template
*]:pointer-events-auto scroll-mt-[calc(var(–header-height)+min(200px,max(70px,20svh)))]” tabindex=”-1″ dir=”auto” data-turn-id=”request-WEB:528532bb-fbd0-48c4-84bd-be7f5905ca43-3″ data-testid=”conversation-turn-8″ data-scroll-anchor=”true” data-turn=”assistant”> $ 29 -
MS Excel, tracking project month, weekly financials incl. contracted work, forecasts, actuals, variance, expenses, pivot
A comprehensive editable, table MS Excel spreadsheet for tracking project monthly financials including summary view tab, contracted work, forecasts, actuals, variance, expenses, annual leave, suppliers and pivot tab. Purchase also includes other budget tracker examples.
$ 30$ 40 -
Project Programme Team Kick Off PowerPoint Microsoft Editable Template
Ready made Project Programme Kick Off template to be tailored as required for project delivery. Helps to structure your thinking by providing guidance and slides for key kick off focus areas. A useful template aid to drive one of the key tasks of a project that can often be overlooked.
$ 30$ 40 -
Project Programme Team Onboarding Kit Microsoft PowerPoint Editable Template
Editable MS PowerPoint Project & Programme Team Onboarding Kit. Ready-made slides to introduce new team members, project goals, roles & processes.
$ 30$ 40 -
Prince2 & Agile Excel RAID log template, track project Risks, Assumptions, Issues, Dependencies (plus other key logs)
Prince2 & Agile Excel RAID log template to track Risks, Assumptions, Issues, Dependencies & more. Editable, comprehensive & ideal for project managers.
$ 30$ 40 -
Programme, Project Benefits Realization Tracker MS Template for Recording & Tracking project benefits, baseline & status
MS Excel template for Programme & Project Benefits Realization tracking. Record benefits, baselines, targets & RAG status to monitor project outcomes.
$ 30$ 40 -
MS Excel Template Agile SCRUM Sprint Burn Down Chart Table & Burn Up Chart where no access to Agile tools like Jira
Editable MS Excel template for Agile Scrum burn down & burn up charts. Perfect for sprint tracking & reporting when Jira or Agile tools aren’t available.
$ 30$ 40