-
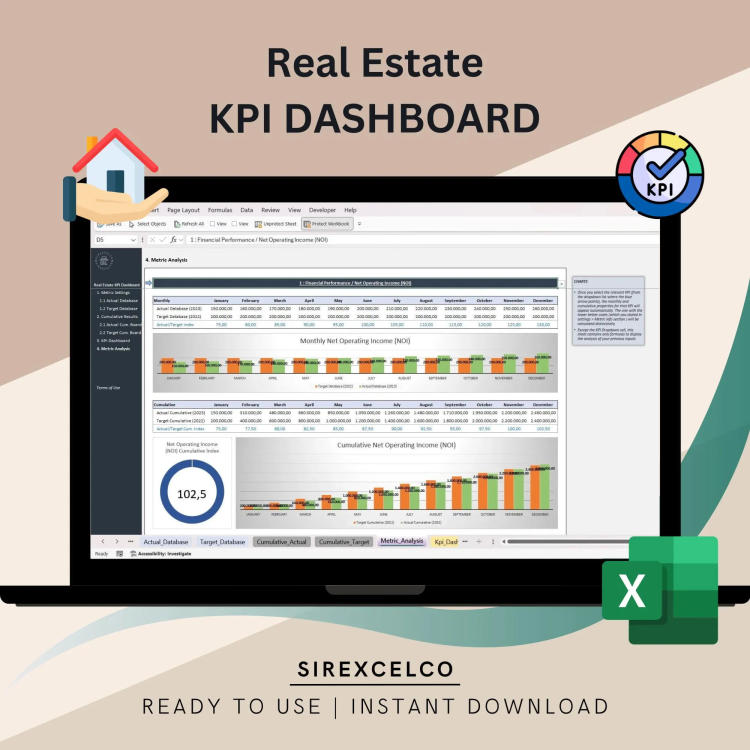
Real Estate KPI Dashboard Excel Template | Dynamic Real Estate Performance Tracker | Monthly & Cumulative KPI Metrics Analysis
Easily track and compare your real estate KPI metrics with our Real Estate KPI Dashboard Excel Template.
For more details about the template, check the link below;
Designed for property managers, real estate professionals, and homeowners, this dynamic Excel template lets you monitor key performance indicators month by month and cumulatively. Compare actual results with target metrics, all represented through customizable dynamic charts. Whether you’re tracking property sales, occupancy rates, or financial performance, this tool provides clear data insights to help optimize your real estate investments. It’s simple to use, making complex performance tracking easier than ever.
With a fully customizable layout, you can tailor the dashboard to suit your specific needs and goals. Monitor your portfolio’s performance and make informed decisions using clear, organized data—all in one place.
Whether you’re managing multiple properties or just getting started, this template will save you time and provide insights that help you grow your business.
Key Features:
Dynamic and fully editable Excel dashboard
Tracks essential real estate KPIs like revenue, occupancy, and expenses
Customizable for any property type or portfolio size
Simple to use, even if you’re not an Excel expert
Ideal for property managers, real estate investors, and agents
Content:
• Excel file compatible with Excel 2010 and higher (and with sample data)
• Professional Design
• Works both on Mac and Windows
• No installation needed. Ready to use
• Dashboard with charts
• Real Estate KPI Dashboard
• Easy to use
• 100% editable
• Excel file
• Instant download
• Friendly customer support for all your questions
License: Private Use (not for distribution or resale)
$ 35 -
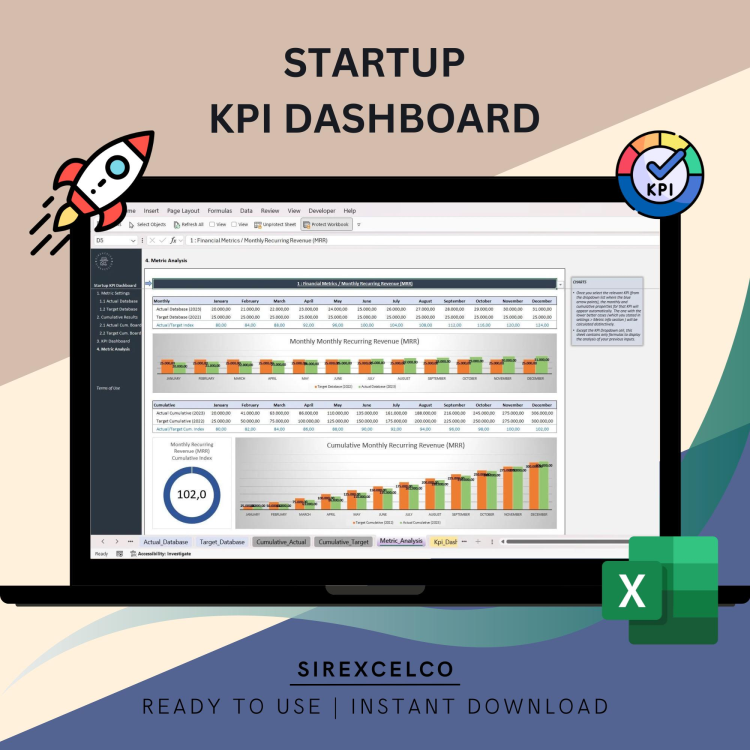
Startup KPI Dashboard Excel Template | Dynamic Monthly & Cumulative KPI Metrics Tracker | Target vs Actual Performance Analysis
Monitor your startup’s key performance indicators effortlessly with our Startup KPI Dashboard Excel Template.
This easy-to-use, dynamic tool allows you to track essential metrics month by month and cumulatively. Compare your startup’s actual performance against target metrics and visualize your data with customizable, dynamic charts. Whether you’re measuring sales, customer acquisition, or growth metrics, this template offers actionable insights to help your startup scale efficiently. Ideal for founders, startup teams, and entrepreneurs seeking clear, data-driven decision-making tools.
For more details about the template, check the link below;
Customizable and easy to use, you can tailor this dashboard to fit your unique business needs. Save time on reporting and focus on growing your startup by having all the important data clearly organized in a single, easy-to-read dashboard.
This tool is perfect for founders, entrepreneurs, and startup teams looking for an efficient way to monitor their KPIs and make data-driven decisions.
Key Features:
Dynamic and fully editable Excel template
Track essential startup KPIs including revenue, customer acquisition, and expenses
Customizable layout to suit your startup’s specific goals
User-friendly, no advanced Excel skills needed
Perfect for startup founders, business owners, and growth teams
Content:
• Excel file compatible with Excel 2010 and higher (and with sample data)
• Professional Design
• Works both on Mac and Windows
• No installation needed. Ready to use
• Dashboard with charts
• Startup KPI Dashboard
• Easy to use
• 100% editable
• Excel file
• Instant download
• Friendly customer support for all your questions
License: Private Use (not for distribution or resale)
$ 35 -
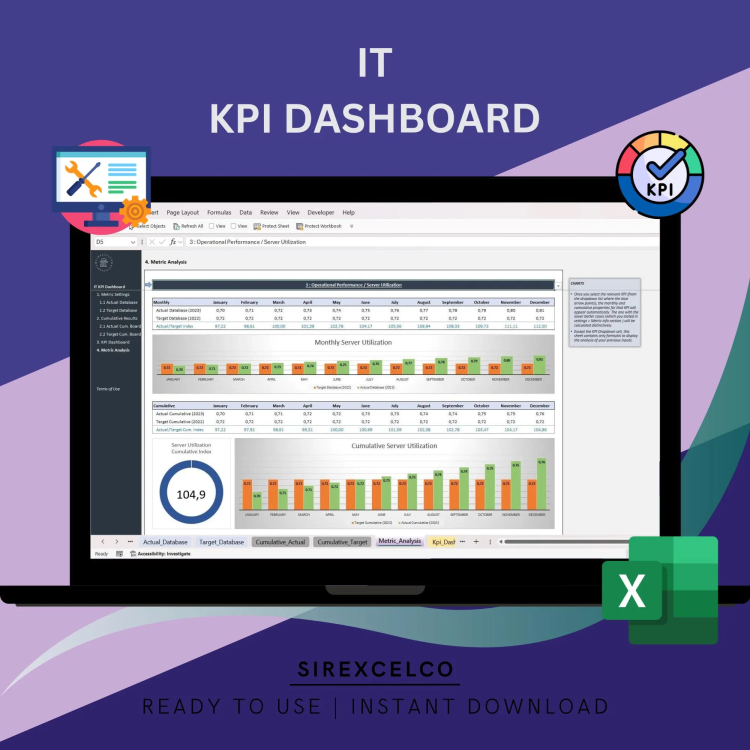
IT KPI Dashboard Excel Template | Monthly Cumulative Performance Tracker | IT Metrics Performance Report | Customizable Editable Spreadsheet
Stay on Top of Your IT Performance with This Easy-to-Use IT KPI Dashboard Template
Are you looking for a simple yet powerful way to track and manage your IT department’s performance? This IT KPI Dashboard Excel Template is designed to help you keep an eye on your key metrics every month. Whether you’re a project manager, IT lead, or small business owner, this template lets you track KPIs month by month, with the added bonus of automatically calculating cumulative results for easy reporting.
For more details about the template, check the link below;
Why You’ll Love This Template:
Track IT KPIs with ease—no complicated software needed.
Monthly and cumulative views for a complete picture of your performance.
Customizable layout to fit your business’s unique needs.
Simple analysis tools to help you pinpoint trends and areas for improvement.
Perfect for IT managers, analysts, and anyone who needs clear, actionable insights.
Save time and stress less with this powerful tool. Get organized, make smarter decisions, and keep your IT projects running smoothly.
Content:
• Excel file compatible with Excel 2010 and higher (and with sample data)
• Professional Design
• Works both on Mac and Windows
• No installation needed. Ready to use
• Dashboard with charts
• IT KPI Dashboard
• Easy to use
• 100% editable
• Excel file
• Instant download
• Friendly customer support for all your questions
$ 35 -

Non Profit KPI Dashboard Excel Template, KPI Report, Dynamic Editable Performance Tracking Tool, Reporting File, Ready to Download
Make managing your nonprofit’s performance easier with this dynamic and editable Non Profit KPI Dashboard Excel Template.
Whether you’re tracking donations, volunteer hours, or program impact, this template helps you stay on top of key metrics and make data-driven decisions.
For more details about the template, check the link below;
With this easy-to-use tool, you can customize the dashboard to fit your nonprofit’s unique goals, track progress, and generate clear reports. Ideal for nonprofit organizations, charities, and social enterprises, it saves you time and helps keep your team focused on what matters.
Perfect for nonprofit managers, directors, and anyone responsible for tracking performance and reporting, this template helps simplify your workload.
Key Features:
Fully customizable and editable Excel dashboard
Tracks key nonprofit KPIs like donations, volunteers, and program results
Simple design for easy use, no advanced Excel skills needed
Ready to download and start using immediately
Ideal for nonprofits, charities, and social impact projects
Content:
• Excel file compatible with Excel 2010 and higher (and with sample data)
• Professional Design
• Works both on Mac and Windows
• No installation needed. Ready to use
• Dashboard with charts
• Non-Profit KPI Dashboard Template
• Easy to use
• 100% editable
• Excel file
• Instant download
• Friendly customer support for all your questions
License: Private Use (not for distribution or resale)
$ 35 -

Risk Management KPI Dashboard Excel Template, Excel Risk Metrics Report Template Digital File, Risk Assessment Dynamic Reporting Tracker
Risk Management KPI Dashboard
Introducing our cutting-edge “Risk Management KPI Dashboard | Excel Risk Metrics Report Template | Dynamic Analytics Tool | Decision-Making Companion.” This meticulously crafted, dynamic reporting tool is poised to revolutionize the way you navigate and optimize your risk management processes.
For more details about the template, check the link below;
Crafted with precision using Microsoft Excel and Google Sheets, this digital download transcends the boundaries of a typical spreadsheet – it’s your strategic ally in decision-making.
✨Instant Download: No waiting required. Access your dashboard immediately after purchase.
📊Excel Dashboard: Effortlessly view and manage a wealth of data for comprehensive risk analysis.
📉Risk Management KPI: Track multiple key performance indicators in a centralized location for maximum efficiency.
📝Metrics Report Template: Streamline the creation of detailed reports, allowing you to focus on strategic planning.
🎯Dynamic Analytics Tool: Monitor progress, identify trends, and achieve your risk management objectives with ease.
📑Excel Template: Top-notch design for user-friendly experience, adaptability, and accuracy.
Product Specifications:
💽File Type: XLSX
📈Form/Template: Excel Spreadsheet, Excel Sheet
✅Requirement: Microsoft Excel
💻Compatibility: Google Sheets
🏷️Function: Printable, Decision Making Tool, Data Organizer, Analytics Tool
🌐Access: Fully accessible and easy to use.
Craftsmanship: This isn’t just an Excel sheet; it’s a robust planning tool with meticulous attention to detail. Every element is carefully designed to ensure your success. The tool is easily customizable to suit your exact needs and built to evolve with your risk management strategies.
Digital Materials: Spreadsheet, Microsoft Excel, Excel Spreadsheet, Excel Sheet, Printable, Decision Making Tool, Analytics Tool, Google Sheets, Easy to Use, XLSX, Excel.
Thank you for choosing our product. Your success is a testament to our commitment to creating impactful tools. We appreciate your choice and honor the craftsmanship that goes into developing our products.
Make sure to explore other innovative products in our shop – each meticulously designed to support and enhance your projects. Take your time, and you’ll discover numerous tools to assist, inspire, and elevate your risk management endeavors. Wishing you abundant success!
$ 35 -
OpEx – JIT Heijunka, Load Levelling
Heijunka: Production Leveling This document
from OpExNZL, authored by Vishnu Rayapeddi, provides a comprehensive overview
of Heijunka, or production levelling, as a gateway to operational excellence.
It outlines prerequisites for implementing Heijunka, including 5S, Standard
Work, and SMED (Quick Changeovers). The core concepts of Just-In-Time (JIT)
manufacturing are thoroughly explained, encompassing Takt Time, Continuous
Flow, and Pull Systems. The document details the benefits, applications, and
success factors for each of these JIT principles, offering practical examples
and visual aids like cellular manufacturing layouts and Kanban systems.
Finally, it focuses on Production Levelling, contrasting it with batch
manufacturing, demonstrating its benefits in managing customer demand and variations,
and outlining steps for its incorporation, such as calculating Takt Time and
Pitch and using a Leveling Box.$ 34$ 39OpEx – JIT Heijunka, Load Levelling
$ 34$ 39 -
OpEx – Poka-Yoke (Mistake Proofing)
Poka-Yoke: The Art of Mistake Proofing
The source, titled “OpEx – Poka Yoke Mistake proofing.pdf,” outlines a comprehensive approach to achieving operational excellence through mistake-proofing, also known as Poka-Yoke. It emphasises that defects account for a significant portion of production costs and stresses the importance of preventing errors at the source rather than merely inspecting them out. The document introduces principles for achieving zero defects, focusing on process control over individual blame, and explores various categories of error and their prevention strategies. It details six mistake-proofing techniques—elimination, replacement, prevention, facilitation, detection, and mitigation—providing examples for each. Finally, it presents a seven-step framework for implementing error-proofing and a five-part project methodology for designing defects out of processes, encouraging continuous improvement and team invol$ 34$ 39OpEx – Poka-Yoke (Mistake Proofing)
$ 34$ 39 -
OpEx – SCM Fundamentals – Demand Forecasting
This source, titled “OpEx- SCM Funda2 Forecasting.pdf” by Vishnu Rayapeddi, provides an extensive overview of demand forecasting within supply chain management. It begins by defining forecasting as educated guessing and a crucial process for business decisions across various time horizons, from short-range (under one year) to long-range (over three years). The document details different types of forecasts, including economic, technological, and demand, and outlines seven key steps in the forecasting process, from determining its use to validating results. Furthermore, the text distinguishes between qualitative forecasting methods (like the Delphi method and sales force composite) and quantitative methods (such as moving averages, exponential smoothing, and linear regression), explaining their applications and calculations, including metrics like Mean Absolute Deviation (MAD) and tracking signals for monitoring forecast accuracy.
$ 34$ 39 -
Project POAP – MS PowerPoint template – Both editable & easy to use
Microsoft PowerPoint template both editable & easy to use, offers a quick way to construct a PPT Project Plan On a Page ( POaP ) for stakeholders
$ 30$ 40 -
Waterfall Project Planner, Project Plan Gantt Chart & Resource Cost / Budget / Revenue Tracker – MS Microsoft Excel (x2)
Waterfall Project Planner with Plan Gantt View and Project Resource Cost Tracker – MS Microsoft Excel Template (2 comprehensive templates for the price of one)
$ 30$ 40 -
Project Management Template, Editable Excel Planner, Gantt Chart for Status Reports, Costing Delivery, Bids
Prince2 & Agile Project Management Templates | Editable Excel Planner, Gantt Chart for Status Reports, Costing Delivery, Bids
$ 30$ 40