-
Prince2 & Agile Excel RAID log template, track project Risks, Assumptions, Issues, Dependencies (plus other key logs)
Prince2 & Agile Excel RAID log template to track Risks, Assumptions, Issues, Dependencies & more. Editable, comprehensive & ideal for project managers.
$ 30$ 40 -
Prince2 & Agile Weekly / Monthly Project Status Report for Client / Internal reporting of Project Health, 3 formats
Prince2 & Agile project status report template in 3 PPT formats. Ideal for client & internal reporting of project health, risks, milestones & progress.
$ 30$ 40 -
PRINCE2 7th Edition Planner MS Templates Download – Both Microsoft Project MPP msp & ms Excel and Word Formats – Prince2
PRINCE2 7th Edition MS Templates Download – Microsoft Project MPP msp ms Excel and Word Formats – Prince2 Template Toolkit
$ 40$ 50 -
Private School Business Plan Template
Explore the comprehensive Private School Business Plan template from Oak Business Consultant. Crafted for educational institutions, our business plan provides strategic insights, financial projections, and a roadmap for success.
$ 250$ 280Private School Business Plan Template
$ 250$ 280 -
Procurement KPI Dashboard
This template was built with real users in mind—designed to save time, reduce manual work, and give you the insight you need to improve performance. Whether for internal tracking or client reporting, it brings structure and professionalism to your data.
$ 39 -

Procurement KPI Report Excel Template | Dynamic Monthly & Cumulative Metrics Tracking | Target vs Actual Performance Dashboard
Introducing our uniquely designed “Procurement KPI Dashboard | Procurement Excel KPI Report Template | Dynamic Reporting Dashboard | Performance Tracking Report”.
A meticulously crafted, dynamic reporting tool that is guaranteed to transform the way you plan and streamline your processes. Engineered using Microsoft Excel and Google Sheets, this digital download is more than just an Excel Spreadsheet: it’s your new decision-making ally.
For more details about the template, check the link below;
Introducing our uniquely designed “Procurement KPI Dashboard | Procurement Excel KPI Report Template | Dynamic Reporting Dashboard | Performance Tracking Report”. A meticulously crafted, dynamic reporting tool that is guaranteed to transform the way you plan and streamline your processes. Engineered using Microsoft Excel and Google Sheets, this digital download is more than just an Excel Spreadsheet: it’s your new decision-making ally.
✨Instant Download: No waiting needed. Have access to your dashboard planner immediately after your purchase.
📊Dashboard Excel: Enables you to view and manage a large amount of data seamlessly.
🔑Procurement KPI: Track multiple performance metrics all in one place – ensuring maximum efficiency.
📝Excel KPI Report Template: Create detailed reports quicker and easier, so you can focus on strategizing.
🎯Performance Tracker: Keep tabs on any progress, identify trends and reach your objectives faster.
📑Excel Template: High-quality templates designed for ease of use, adaptability, and accuracy.
Product Specifications:
💽File Type: XLSX
📈Form/Template: Excel Spreadsheet, Excel Sheet
✅Requirement: Microsoft Excel
💻Compatibility: Google Sheets
🏷️Function: Printable, Decision Making Tool, Decision Maker, Organizing Tool
🌐Access: Fully accessible and easy to use.
Boost your procurement efficiency with our Procurement KPI Report Excel Template! This dynamic and easy-to-use tool is designed to track key procurement metrics month by month and cumulatively, comparing target metrics with actual performance. Whether you’re monitoring supplier performance, cost control, or purchasing efficiency, this template simplifies procurement tracking with dynamic charts that adjust based on the selected metric. Ideal for procurement managers and business owners, it provides real-time insights for better decision-making and improved procurement operations.
Content:
• Excel file compatible with Excel 2010 and higher (and with sample data)
• Professional Design
• Works both on Mac and Windows
• No installation needed. Ready to use
• Dashboard with charts
• Procurement KPI Dashboard Template
• Easy to use
• 100% editable
• Excel file
• Instant download
• Friendly customer support for all your questions
License: Private Use (not for distribution or resale)
$ 35 -
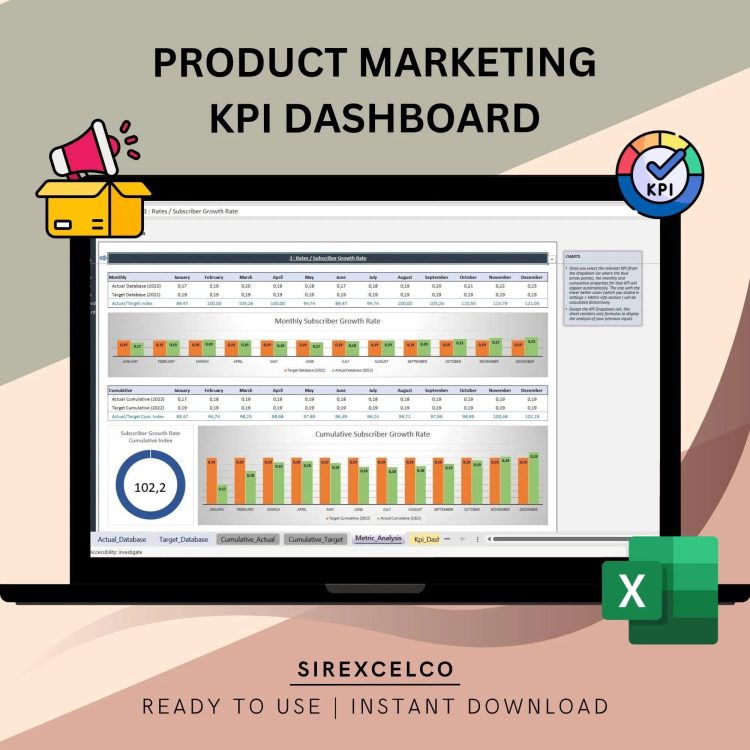
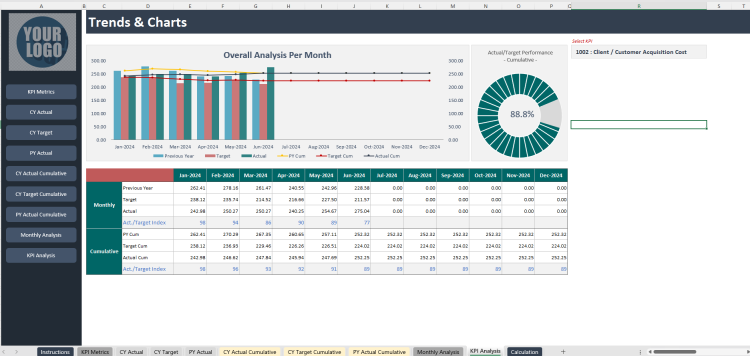
Product Marketing KPI Dashboard Excel Template | Dynamic Product Performance Tracker | Monthly & Cumulative Marketing KPI Analysis
Simplify your product marketing performance tracking with our Product Marketing KPI Dashboard Excel Template.
For more details about the template, check the link below;
This user-friendly Excel template allows marketers, product managers, and business owners to measure and compare key product marketing metrics month by month and cumulatively. Whether you need to track sales, customer acquisition, or campaign performance, this tool dynamically updates with interactive charts, letting you instantly compare target vs. actual metrics. Perfect for anyone looking to make data-driven decisions and improve marketing strategies, this template is designed for ease of use while providing deep insights into product performance.
What this means is that finding the right product marketing metrics is extremely crucial. Among the sea of options available, it’s important to identify which metrics are key to the success of your business. Otherwise, it’s easy to miss the wood for the trees and start tracking too much or too little.
Best for:
• Marketing Experts
• Product Marketers
• Everyone starting with a new project
Content:
• Excel file compatible with Excel 2010 and higher (and with sample data)
• Professional Design
• Works both on Mac and Windows
• No installation needed. Ready to use
• Dashboard with charts
• Product Management KPI Dashboard Template
• Easy to use
• 100% editable
• Excel file
• Instant download
• Friendly customer support for all your questions
License: Private Use (not for distribution or resale)
$ 35 -

Professional Services Financial Model
The fully upgraded Professional Services or Agency Financial Model is a comprehensive tool designed for businesses’ billing time. It includes projections for five years, covering income statements, balance sheets, cash flow statements, CapEx, and an upgraded cap table. Fully customizable, it supports scenario planning, revenue forecasts, professional types, fixed and variable costs, and investor equity calculations. Ideal for agencies and firms like law or CPA practices, this model is perfect for financial planning and scaling.
$ 75 -
Programme, Project Benefits Realization Tracker MS Template for Recording & Tracking project benefits, baseline & status
MS Excel template for Programme & Project Benefits Realization tracking. Record benefits, baselines, targets & RAG status to monitor project outcomes.
$ 30$ 40 -

Project Management Excel Template
Introducing our advanced Project Management Excel Template, crafted to elevate your project planning and budgeting efficiency.
$ 29 -
Project Management KPI Dashboard
This template was built with real users in mind—designed to save time, reduce manual work, and give you the insight you need to improve performance. Whether for internal tracking or client reporting, it brings structure and professionalism to your data.
$ 39 -

Project Management KPI Report Excel Template | Track Monthly and Cumulative Metrics | Dynamic Charts & Performance Analysis
Take control of your projects with the Project Management KPI Report Excel Template!
For more details about the template, check the link below;
This template makes it easy to monitor your project performance by tracking key metrics month by month and cumulatively. Whether you need to compare target metrics with actual results or visualize progress through dynamic charts, this tool simplifies the process for project managers, team leaders, and business professionals.
No advanced Excel skills are needed to use this fully customizable template. Simply input your project data, choose the metric you want to focus on, and the template will automatically generate reports and charts to keep your projects on track.
Key Features:
Track project management KPIs monthly and cumulatively
Compare target vs actual performance metrics
Dynamic charts that update automatically based on the selected metrics
User-friendly and fully customizable to your project needs
Ideal for project managers, team leads, and business professionals
No advanced Excel knowledge required
This template helps you make data-driven decisions and ensures that your projects are completed efficiently and on time.
Content:
• Excel file compatible with Excel 2010 and higher (and with sample data)
• Professional Design
• Works both on Mac and Windows
• No installation needed. Ready to use
• Dashboard with charts
• Project Management KPI Dashboard Template
• Easy to use
• 100% editable
• Excel file
• Instant download
• Friendly customer support for all your questions
License: Private Use (not for distribution or resale)
$ 35


