What is Comparable Analysis?
Comparable Analysis (Comps) is a valuation method used to assess the value of a company, asset, or investment by comparing it to similar companies or assets within the same industry. This approach involves analyzing key financial metrics and valuation multiples from comparable companies to estimate the target’s market value. Comparable Analysis is widely used in investment banking, private equity, and corporate finance to provide a market-based valuation that reflects current industry trends and investor sentiment.
Key Steps in Comparable Analysis:
Identify Comparable Companies: Select a group of companies that are similar to the target in terms of size, industry, business model, growth prospects, and financial characteristics.
Gather Financial Data: Collect relevant financial data, including revenue, EBITDA, net income, and key balance sheet items from public filings, financial reports, or market databases.
Calculate Valuation Multiples: Common multiples used in Comparable Analysis include Price-to-Earnings (P/E), Enterprise Value-to-EBITDA (EV/EBITDA), and Price-to-Sales (P/S). These multiples are calculated based on the financial data of the comparable companies.
Apply Multiples to the Target Company: Use the average or median multiples from the comparable companies and apply them to the target company’s financial metrics to estimate its value.
Adjust for Differences: Adjustments may be needed to account for differences between the target and the comparables, such as growth rates, margins, or risk factors, to ensure a fair comparison.
Why Comparable Analysis is Important:
Market-Driven: It reflects current market conditions and investor perceptions, providing a realistic valuation based on actual market data.
Quick and Intuitive: Compared to other valuation methods like Discounted Cash Flow (DCF), Comparable Analysis is straightforward and less time-consuming.
Benchmarking Tool: It helps investors, analysts, and executives benchmark a company’s valuation against peers, highlighting how the market values similar businesses.
Comparable Analysis is a widely used tool for making informed valuation decisions, especially when a quick and market-based estimate of value is needed.
-

Ecommerce CAC & LTV Calculator
The E-Commerce Unit Economics & CAC/LTV Calculator is designed to give e-commerce founders, operators, and investors a clear, data-driven view of customer acquisition efficiency and long-term customer value. Whether you are running a DTC brand, a Shopify store, an Amazon storefront, or a multi-channel retail operation, this model helps you answer the fundamental questions that drive sustainable growth:
• How much does it truly cost to acquire a customer across each marketing channel?
• What is the lifetime value of your customers, and how does it compare to acquisition cost?
• Which channels deliver the best return on ad spend and the healthiest unit economics?
• At what point does your business achieve CAC payback, and how does that change under different scenarios?
• How do changes in retention, average order value, and purchase frequency impact long-term profitability?
The model is built to be straightforward enough for founders evaluating their first marketing budget, yet robust enough for CFOs and investors conducting due diligence on customer economics. It bridges the gap between high-level KPI dashboards and detailed financial projections by providing a comprehensive, assumption-driven framework.
$ 60 -
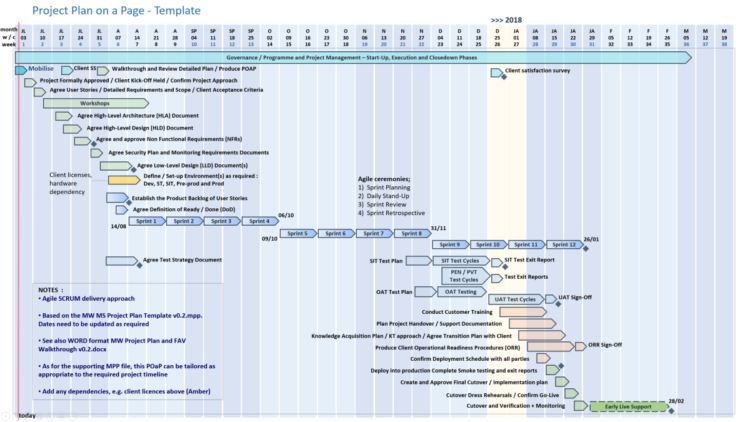
200+ PM Templates | FREE Upgrades and Additions | Agile, Waterfall & Prince2 Project Management Templates
200+ PM Templates | FREE Upgrades and Additions | Agile, Waterfall & Prince2 Project Management Templates | Microsoft Project Excel PowerPoint + RAID Log, POaP, Gantt View with Resource Cost Tracker etc.
FREE template upgrades for life available after purchase. This package contains ALL the PM templates offered by the seller,
The PM templates download link is contained in an ‘officedocdepot’ text file made available immediately after your purchase.
$ 89$ 120 -
Golf Course Financial Model
These Excel-based models provide a comprehensive 5-year financial forecast for golf courses, available in two specialized versions: one for public/daily-fee courses and another for membership-based operations. Both models include detailed revenue calculations, comprehensive expense modeling, 3-statement financial reports, IRR analysis, cap table management, and exit valuation.
$ 230 -
End-to-End Space Company Financial Model
This comprehensive financial model is designed for space startups, offering up to 10 years of detailed forecasting. It covers launch services, satellite manufacturing, constellation services, fixed costs, cap tables, loans, and more. With customizable assumptions, dynamic revenue projections, and in-depth financial statements (income statement, balance sheet, cash flow), this model helps plan and manage complex space startup operations. It also includes features like discounted cash flow analysis, investor IRR calculations, and visual insights. Ideal for space startups or satellite companies looking for a detailed and flexible financial planning tool.
$ 75 -

Educational Courses Financial Model
This Excel model forecasts the financial performance of an educational course business over 10 years. It includes detailed course scheduling, revenue projections, expense modeling, 3-statement financial reports, and investor analysis.
$ 75 -
Equipment Rental Financial Model
This upgraded Excel model forecasts the financial performance of an equipment rental business over 10 years. It includes detailed purchase schedules, depreciation logic, 3-statement financial reporting, cap table management, and exit valuation.
$ 75 -

Hair Salon Financial Model
This Excel-based model forecasts the financial performance of a hair salon or barber shop over 10 years. It includes detailed revenue calculations based on haircuts, add-on services, and products, along with comprehensive expense modeling. It generates 3-statement financial reports, IRR analysis, and allows for financing scenarios and exit valuation.
$ 75 -

Franchisor Licensing Financial Model
This Excel-based model forecasts the financial performance of a franchisor over 10 years. It includes detailed revenue calculations based on franchise fees, royalties, and ad fees, comprehensive expense modeling, 3-statement financial reports, IRR analysis, cap table management, and exit valuation.
$ 75 -

Franchise Scaling Financial Model
This Excel-based model forecasts the financial performance of scaling a franchise business with up to 12 locations over 10 years. It includes detailed development costs, franchise fees, revenue projections, debt financing, and cash flow analysis.
$ 45 -

Advanced Financial Model with DCF and Valuation
Dynamic 10-Year Financial Model, suitable for any type of business, supporting strategic planning, investment decisions, and business valuation.
$ 139 -

Discounted Cash Flow (DCF) – Business Valuation Model
User-friendly template providing a Discounted Cash Flow (DCF) valuation method suitable for any type of investment or project. This approach accounts for the time value of money and provides a clear view of an investment’s intrinsic value, making it a widely used method for financial analysis.
$ 79 -

Pharma Biotech Financial Model incl. Risk-Adjusted DCF and VC Valuation
Financial Model analyzing a Biopharmaceutical Company using a Risk-Adjusted NPV Valuation Methodology, designed to support strategic planning across R&D, clinical development, and commercialization. The model tracks costs related to drug development, clinical trials, regulatory milestones, and manufacturing, while projecting revenue from product launches, licensing deals, and partnerships. Whether developing a single asset or managing a broader pipeline, this model delivers the financial structure and insight needed to drive informed decisions and long-term growth.
$ 269