-
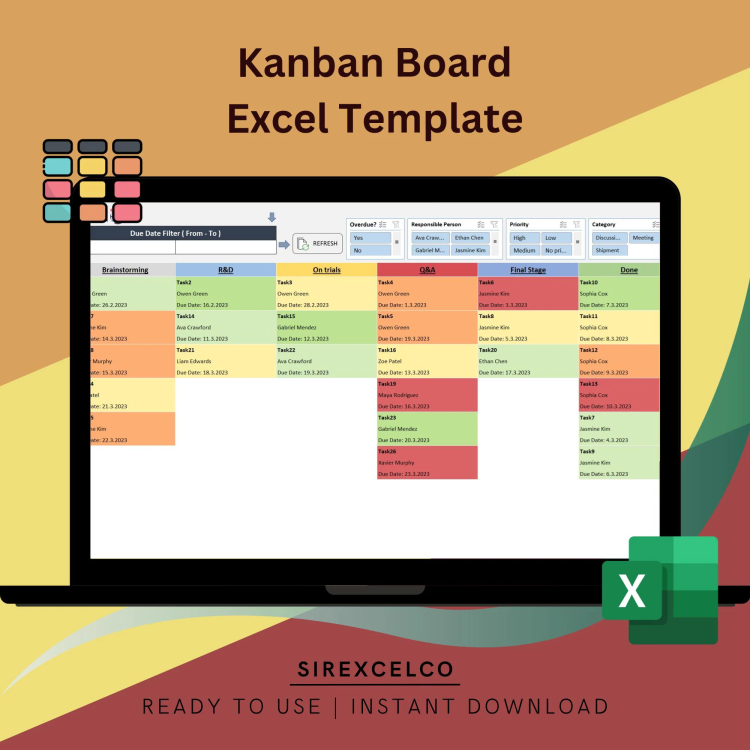
Dynamic Kanban Board Excel Template for Team Workflow Management | Easy Database Entry & Visual Task Tracking Tool
Introducing our Dynamic Kanban Board- the perfect tool for any Project Manager or individual looking to boost their productivity and stay organized!
For more details about the template, check the link below;
This versatile template includes a variety of useful features such as Gantt Charts, Project Timelines, To Do Lists, and Daily To Do Lists to help you stay on top of your tasks and deadlines.
Optimize your team’s workflow with this Dynamic Kanban Board Excel Template. Designed for seamless task management, this template allows you to input your team’s projects into a user-friendly database and visualize progress on an interactive Kanban board. Perfect for agile teams and project managers looking for a straightforward tool to enhance productivity and collaboration. With its dynamic charts and easy navigation, tracking tasks has never been more efficient. Transform your team’s workflow today with this essential project management resource!
Best for:
• Individuals
• Teams
• All types of companies or businesses
Content:
• Excel file compatible with Excel 2010 and higher (and with sample data)
• Professional Design
• Works both on Mac and Windows
• No installation needed. Ready to use
• Dashboard with charts
• Kanban Excel Template
• Easy to use
• 100% editable
• Excel file
• Instant download
• Friendly customer support for all your questions
License: Private Use (not for distribution or resale)
$ 18 -

E-commerce KPI Dashboard Excel Template | Track & Compare E-commerce Metrics | Monthly Cumulative Performance Dashboard
Take control of your e-commerce business with the E-commerce KPI Dashboard Excel Template.
For more details about the template, check the link below;
This dynamic tool is designed to help you measure and compare your e-commerce KPI metrics month by month and in cumulative analysis. Visualize your progress with dynamic charts that update based on the specific metrics you choose, and easily compare actual results with target goals. This template is user-friendly and designed to simplify performance tracking, helping you make data-driven decisions to grow your online business.
KPIs should be chosen and monitored depending on your unique business goals. Certain KPIs support some goals while they’re irrelevant for others. With the idea that KPIs should differ based on the goal being measured, it’s possible to consider a set of common performance indicators for e-commerce.
Best for:
• E-commerce industry
• Marketing professionals
• Online Shopping Experts
• Everyone starting with a new project
Content:
• Excel file compatible with Excel 2010 and higher (and with sample data)
• Professional Design
• Works both on Mac and Windows
• No installation needed. Ready to use
• Dashboard with charts
• E-commerce Kpi Dashboard Template
• Easy to use
• 100% editable
• Excel file
• Instant download
• Friendly customer support for all your questions
License: Private Use (not for distribution or resale)
$ 35 -

Editable Invoice Excel Template | Printable Business Invoice | Small Business Invoice form | With Contact Database | Photography Invoice
Utilize our Editable Invoice Excel Template to streamline your billing procedure!
For more details about the template, check the link below;
By automating the invoicing process and offering a complete database to hold all your client information, this robust template is made to simplify your life. You can quickly and easily create expert invoices that appropriately represent your business thanks to its user-friendly design.
You can customize the template’s many editable fields to make your invoice design speak to your unique requirements. All of your client data is conveniently and securely stored in the built-in customer database, making it accessible anytime you need it.
This template is the ideal tool to help you manage your invoicing process, whether you’re a small business owner, freelancer, or consultant.
Get hold of the Excel invoice template right away to get the most out of your billing procedure and create a Professional Invoice.
Content:
• Excel file compatible with Excel 2007 and higher (and with sample data)
• Professional Design
• Works both on Mac and Windows
• No installation needed. Ready to use
• Invoice Excel Template
• Easy to use
• 100% editable
• Excel file
• Instant download
• Friendly customer support for all your questions
License: Private Use (not for distribution or resale)
Thanks for visiting!
$ 6 -
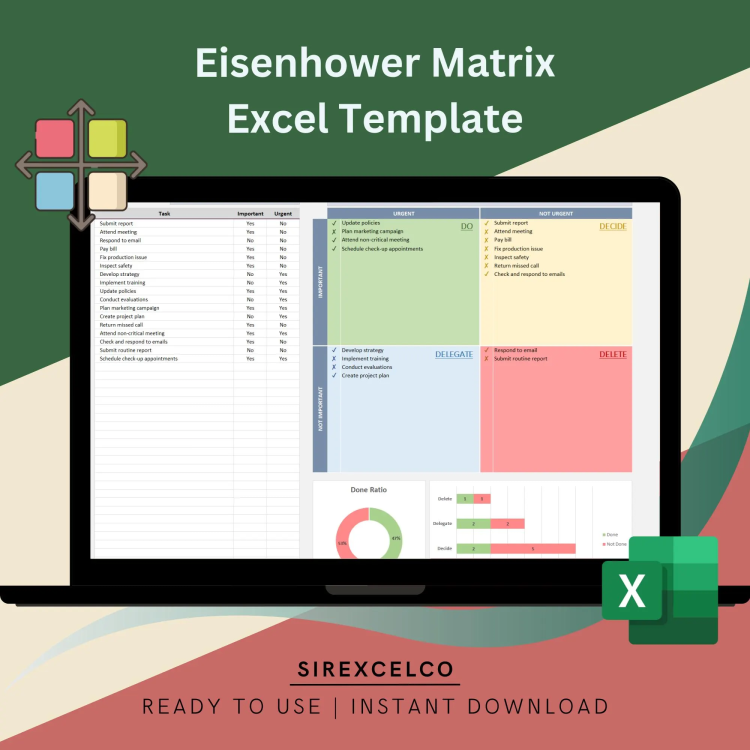
Eisenhower Matrix Task Management Excel Template | Organize & Prioritize | Task Priority Matrix, Decision Matrix, Productivity Planner File
Stay organized and maximize productivity with this Eisenhower Matrix Task Management Excel Template.
For more details about the template, check the link below;
Designed to help you prioritize tasks efficiently, this template categorizes tasks into Do, Decide, Delegate, and Delete, based on the Eisenhower Matrix method. Simply enter your tasks into the database, and the dynamic charts provide a visual breakdown of priorities, enabling you to focus on what truly matters. Perfect for project managers, professionals, and anyone looking to optimize time management, this template offers an intuitive, easy-to-use tool for structured task prioritization and improved workflow.
Whether you’re a busy professional, a student with a packed schedule, or just someone who wants to get organized, our template is the perfect tool to help you achieve your goals. So why not give it a try? Head on over to our shop and check out our Eisenhower Decision Matrix Excel Template today!
Content:
• Excel file compatible with Excel 2007 and higher (and with sample data)
• Professional Design
• Works both on Mac and Windows
• No installation needed. Ready to use
• Dashboard with charts
• Eisenhower Matrix Template
• Easy to use
• 100% editable
• Excel file
• Instant download
• Friendly customer support for all your questions
License: Private Use (not for distribution or resale)
$ 9 -

Electric Substation – 10 Year Financial Model
10-Year Financial Model for an Electric Substation development, built to support detailed planning, cost analysis, and investment evaluation. The model captures capital expenditures, operating and maintenance costs, grid connection fees, and potential revenue from transmission or utility agreements. Whether developing a new substation or upgrading existing infrastructure, this model provides the financial clarity needed to guide decision-making and ensure long-term project viability.
$ 139 -

Email Marketing KPI Report Template | KPI Metric Report | KPI Dashboard Excel Template | Performance Tracking Report | Ready to Download
Email Marketing KPI Report Template
Email marketing is one of the most effective marketing channels today and boasts one of the highest ROIs in the industry.
For more details about the template, check the link below;
However, to find success in email marketing and meet your goals, you need to identify and monitor the appropriate email marketing KPIs.
Best for:
• Email marketers
• Digital Marketing Experts
• Everyone starting with a new project
• Marketing professionals
Content:
• Excel file compatible with Excel 2010 and higher (and with sample data)
• Professional Design
• Works both on Mac and Windows
• No installation needed. Ready to use
• Dashboard with charts
• Email Marketing KPI Dashboard Template
• Easy to use
• 100% editable
• Excel file
• Instant download
• Friendly customer support for all your questions
License: Private Use (not for distribution or resale)
$ 35 -

Energy Management KPI Dashboard Excel Template | Track & Analyze Energy Metrics | Monthly Cumulative Energy Performance Dashboard
Optimize your energy management with this Energy Management KPI Dashboard Excel Template.
For more details about the template, check the link below;
This powerful tool is designed for energy professionals and businesses looking to measure, compare, and analyze energy management KPIs month by month and cumulatively. Easily track your energy metrics, compare actual performance with target goals, and visualize data with dynamic charts that adjust based on your selected metrics. This Excel template is simple, intuitive, and easy to use, helping you make informed decisions that drive energy efficiency and cost savings.
Best for:
• Energy Suppliers
• Energy Industry
• Everyone starting with an energy new project
Content:
• Excel file compatible with Excel 2010 and higher (and with sample data)
• Professional Design
• Works both on Mac and Windows
• No installation needed. Ready to use
• Dashboard with charts
• Energy KPI Dashboard Template
• Easy to use
• 100% editable
• Excel file
• Instant download
• Friendly customer support for all your questions
License: Private Use (not for distribution or resale)
$ 35 -

Finance KPI Dashboard Excel Template | Track & Analyze Financial Metrics | Monthly Cumulative Reports | Dynamic Charts | Easy to Use
Optimize your financial performance tracking with the Finance KPI Dashboard Excel Template.
For more details about the template, check the link below;
This easy-to-use template allows you to measure, compare, and analyze finance KPIs month by month, alongside cumulative data analysis. With dynamic charts that adjust based on your selected metric, you can effortlessly visualize and track financial goals, comparing actual performance against target metrics. Whether you’re focused on budgeting, profitability, or cost control, this dashboard provides actionable insights into your financial health. Ideal for finance professionals, startups, and businesses looking to streamline their financial reporting.
Regardless of the size, age, and industry, each and every company needs to be conscious of their financial performance. While accountants deal with all the expenses, income and budgets, the company’s leadership also needs to be informed about important financial measures.
After you insert your Monthly Numeric data for the KPI Metrics you determine, you can see a clear monthly and cumulative analysis for the metrics you determine. It is also possible to compare your numeric data with your target data and past year data.
The fastest and most efficient way to keep track of an organization’s business performance is to set up a KPI dashboard that displays financial metrics.
Best for:
• All types of companies
• Everyone opening a business
• Finance & accounting professionals
• Everyone starting with a new project
• Start-ups
Content:
• Excel file compatible with Excel 2010 and higher (and with sample data)
• Professional Design
• Works both on Mac and Windows
• No installation needed. Ready to use
• Dashboard with charts
• Finance KPI Dashboard Template
• Easy to use
• 100% editable
• Excel file
• Instant download
• Friendly customer support for all your questions
License: Private Use (not for distribution or resale)
$ 35 -
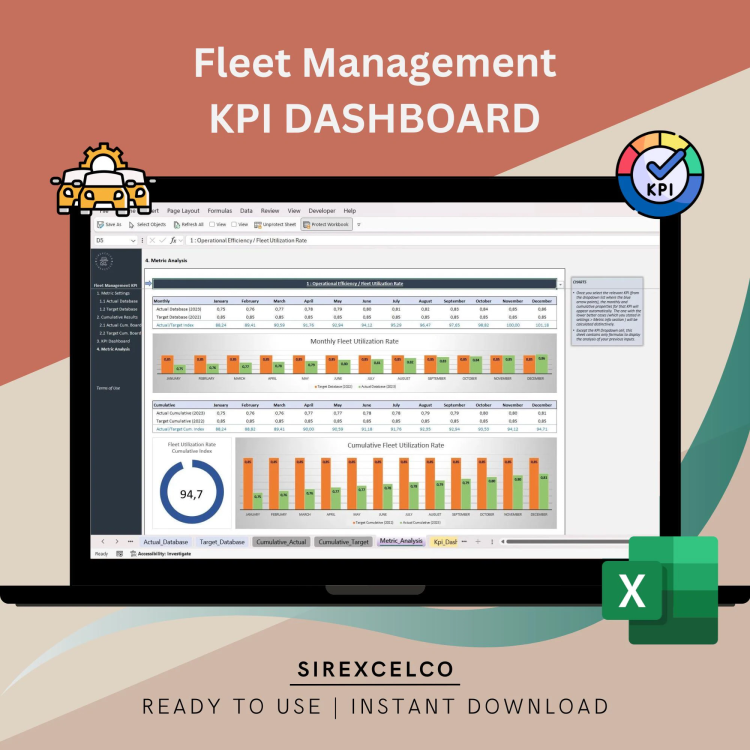
Fleet Management KPI Dashboard Excel Template, KPI Report, Dynamic Editable Performance Tracking Tool, Reporting File, Ready to Download
Keep your fleet operations running smoothly with this dynamic and editable Fleet Management KPI Dashboard Excel Template.
For more details about the template, check the link below;
Designed for fleet managers and logistics teams, this easy-to-use tool allows you to track key metrics like fuel efficiency, maintenance costs, vehicle utilization, and more—all in one place.
Fully customizable, you can tailor this dashboard to fit your unique fleet needs, helping you stay organized and make data-driven decisions to optimize performance. Whether you’re managing a small or large fleet, this template simplifies your reporting and keeps all your KPIs in clear view.
Perfect for fleet managers, logistics coordinators, and business owners who want an efficient way to monitor their fleet’s performance.
Key Features:
Fully editable and customizable Excel dashboard
Track essential fleet KPIs like fuel costs, maintenance, and utilization
Simple design for easy use, even without advanced Excel skills
Ready to download and start using immediately
Ideal for fleet managers, logistics teams, and operations departments
Content:
• Excel file compatible with Excel 2010 and higher (and with sample data)
• Professional Design
• Works both on Mac and Windows
• No installation needed. Ready to use
• Dashboard with charts
• Fleet Management KPI Dashboard Template
• Easy to use
• 100% editable
• Excel file
• Instant download
• Friendly customer support for all your questions
$ 35 -

Floating Storage Regasification Unit – Project Finance Model
Project Finance Model for a Floating Storage and Regasification Unit (FSRU), covering capital costs, operating expenses, LNG procurement, regasification revenue, and charter agreements. The model supports financial forecasting, project valuation, and risk analysis, with flexible inputs for utilization rates, contract terms, and fuel price scenarios. It provides a solid financial framework for assessing profitability and guiding strategic decisions.
$ 149 -

FMCG KPI Report Excel Template | Dynamic Monthly & Cumulative Metrics Tracker | Target vs Actual Performance Analysis
Optimize your fast-moving consumer goods (FMCG) business with our FMCG KPI Report Excel Template!
For more details about the template, check the link below;
This dynamic, easy-to-use tool allows you to track essential metrics month by month and cumulatively, helping you compare target KPIs with actual performance. The template includes real-time dynamic charts that adjust based on the metrics selected, providing quick insights into your FMCG performance. Designed for managers and business owners, this template simplifies performance tracking, ensuring you stay ahead in the competitive FMCG sector.
Content:
• Excel file compatible with Excel 2010 and higher (and with sample data)
• Professional Design
• Works both on Mac and Windows
• No installation needed. Ready to use
• Dashboard with charts
• FMCG KPI Dashboard Template
• Easy to use
• 100% editable
• Excel file
• Instant download
• Friendly customer support for all your questions
License: Private Use (not for distribution or resale)
$ 35 -
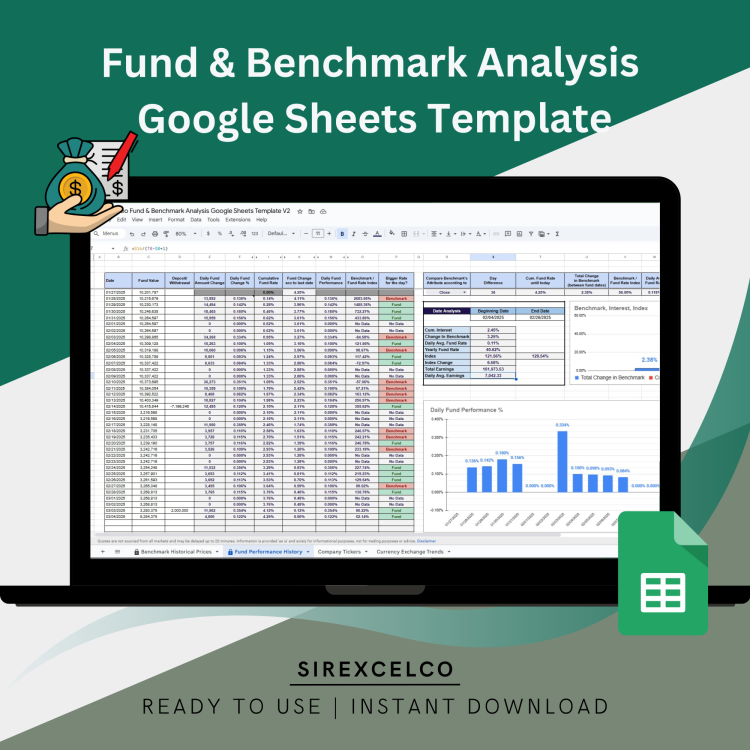
Fund & Benchmark Analysis Google Sheets Template | Investment Analytics | Performance Tracking | Compare Funds with Custom Benchmarks
Easily track your investment performance with this Google Sheets Fund Performance Tracker.
For more details about the template, check the link below;
This dynamic and easy-to-use template helps investors analyze their fund’s daily performance while comparing it to a custom benchmark—whether it’s a currency, stock, or mutual fund. Get insights on Cumulative Interest, Benchmark Changes, Daily & Yearly Fund Rates, Total Earnings, and more. Simply enter your data, and the template automatically generates key analytics and comparisons. Perfect for investors looking for a structured and insightful way to monitor and optimize their portfolio performance.
$ 40